Basics of Distribution Grids & Managing Grid Stability
(15-20 Mins Read)
THIS ARTICLE WILL COVER:
- Types of Distribution lines.
- Types of Faults On Distribution lines.
- Power System Reliability: SAIDI, SAIFI & CAIDI.
- Solutions to Manage a Power Grid Effectively & Maintain Stability.
Whether you’re operating an electric utility, grid-substations, commercial scale business of any size or simply looking to understand how keeping the lights on at home plays a part with the power-grid. This article will briefly go over the simplified version of some of the basics in effectively managing a distribution grid.
In the midst of the current period of rapid digitalization and global transition initiatives towards a greener energy grid, it’s imperative to understand the basics of how you and many others, as everyday consumers of energy, could be impacted by the effective management of a distribution grid. Whether power lines are based on an overhead or underground configuration, it’s vital for energy producers and consumers alike to understand how all of this could affect your operations and potentially, your financial bottom lines.
TYPES OF DISTRIBUTION LINES
There are various types of distribution lines that flow from power-generating activities towards power transmission and ultimately distribution and consumption.
Without getting too technical with single-line diagrams or anything of the sort, at the distribution level, the network of distribution infrastructure can be based on either an “Overhead” or “Underground” power line configuration depending on multiple variables such as engineering design, budget, technicalities, and power-market legal-technical regulation etc.
In Cambodia, overhead distribution lines are quite common for the majority on either power transmission or power distribution operations. Although some zones are developing or transitioning the power network towards an underground line configuration, the overhead lines are usually found in most developing countries for their cost-effectiveness and time taken to construct, relative to underground power lines.
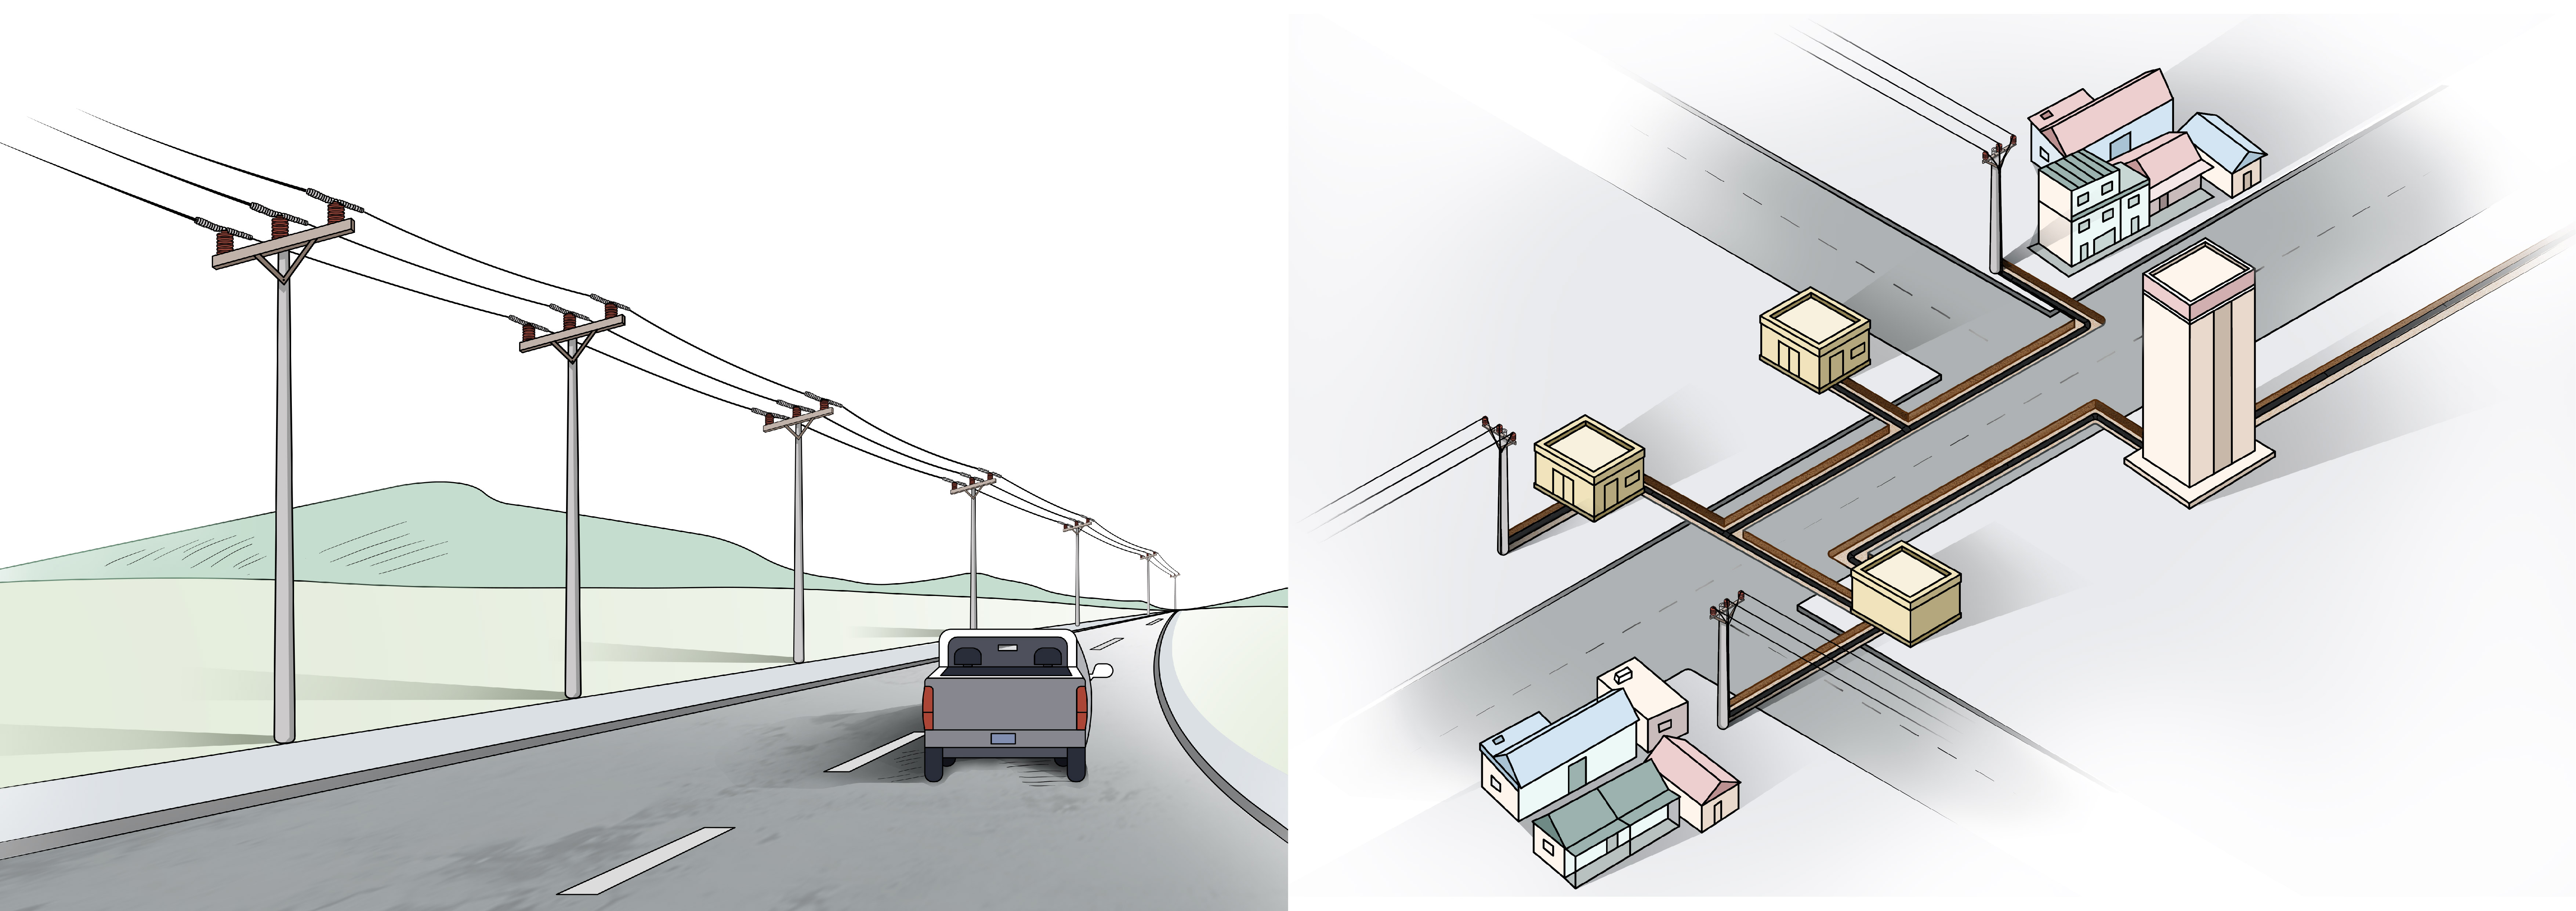
(Overhead-lines) (Underground-Lines)
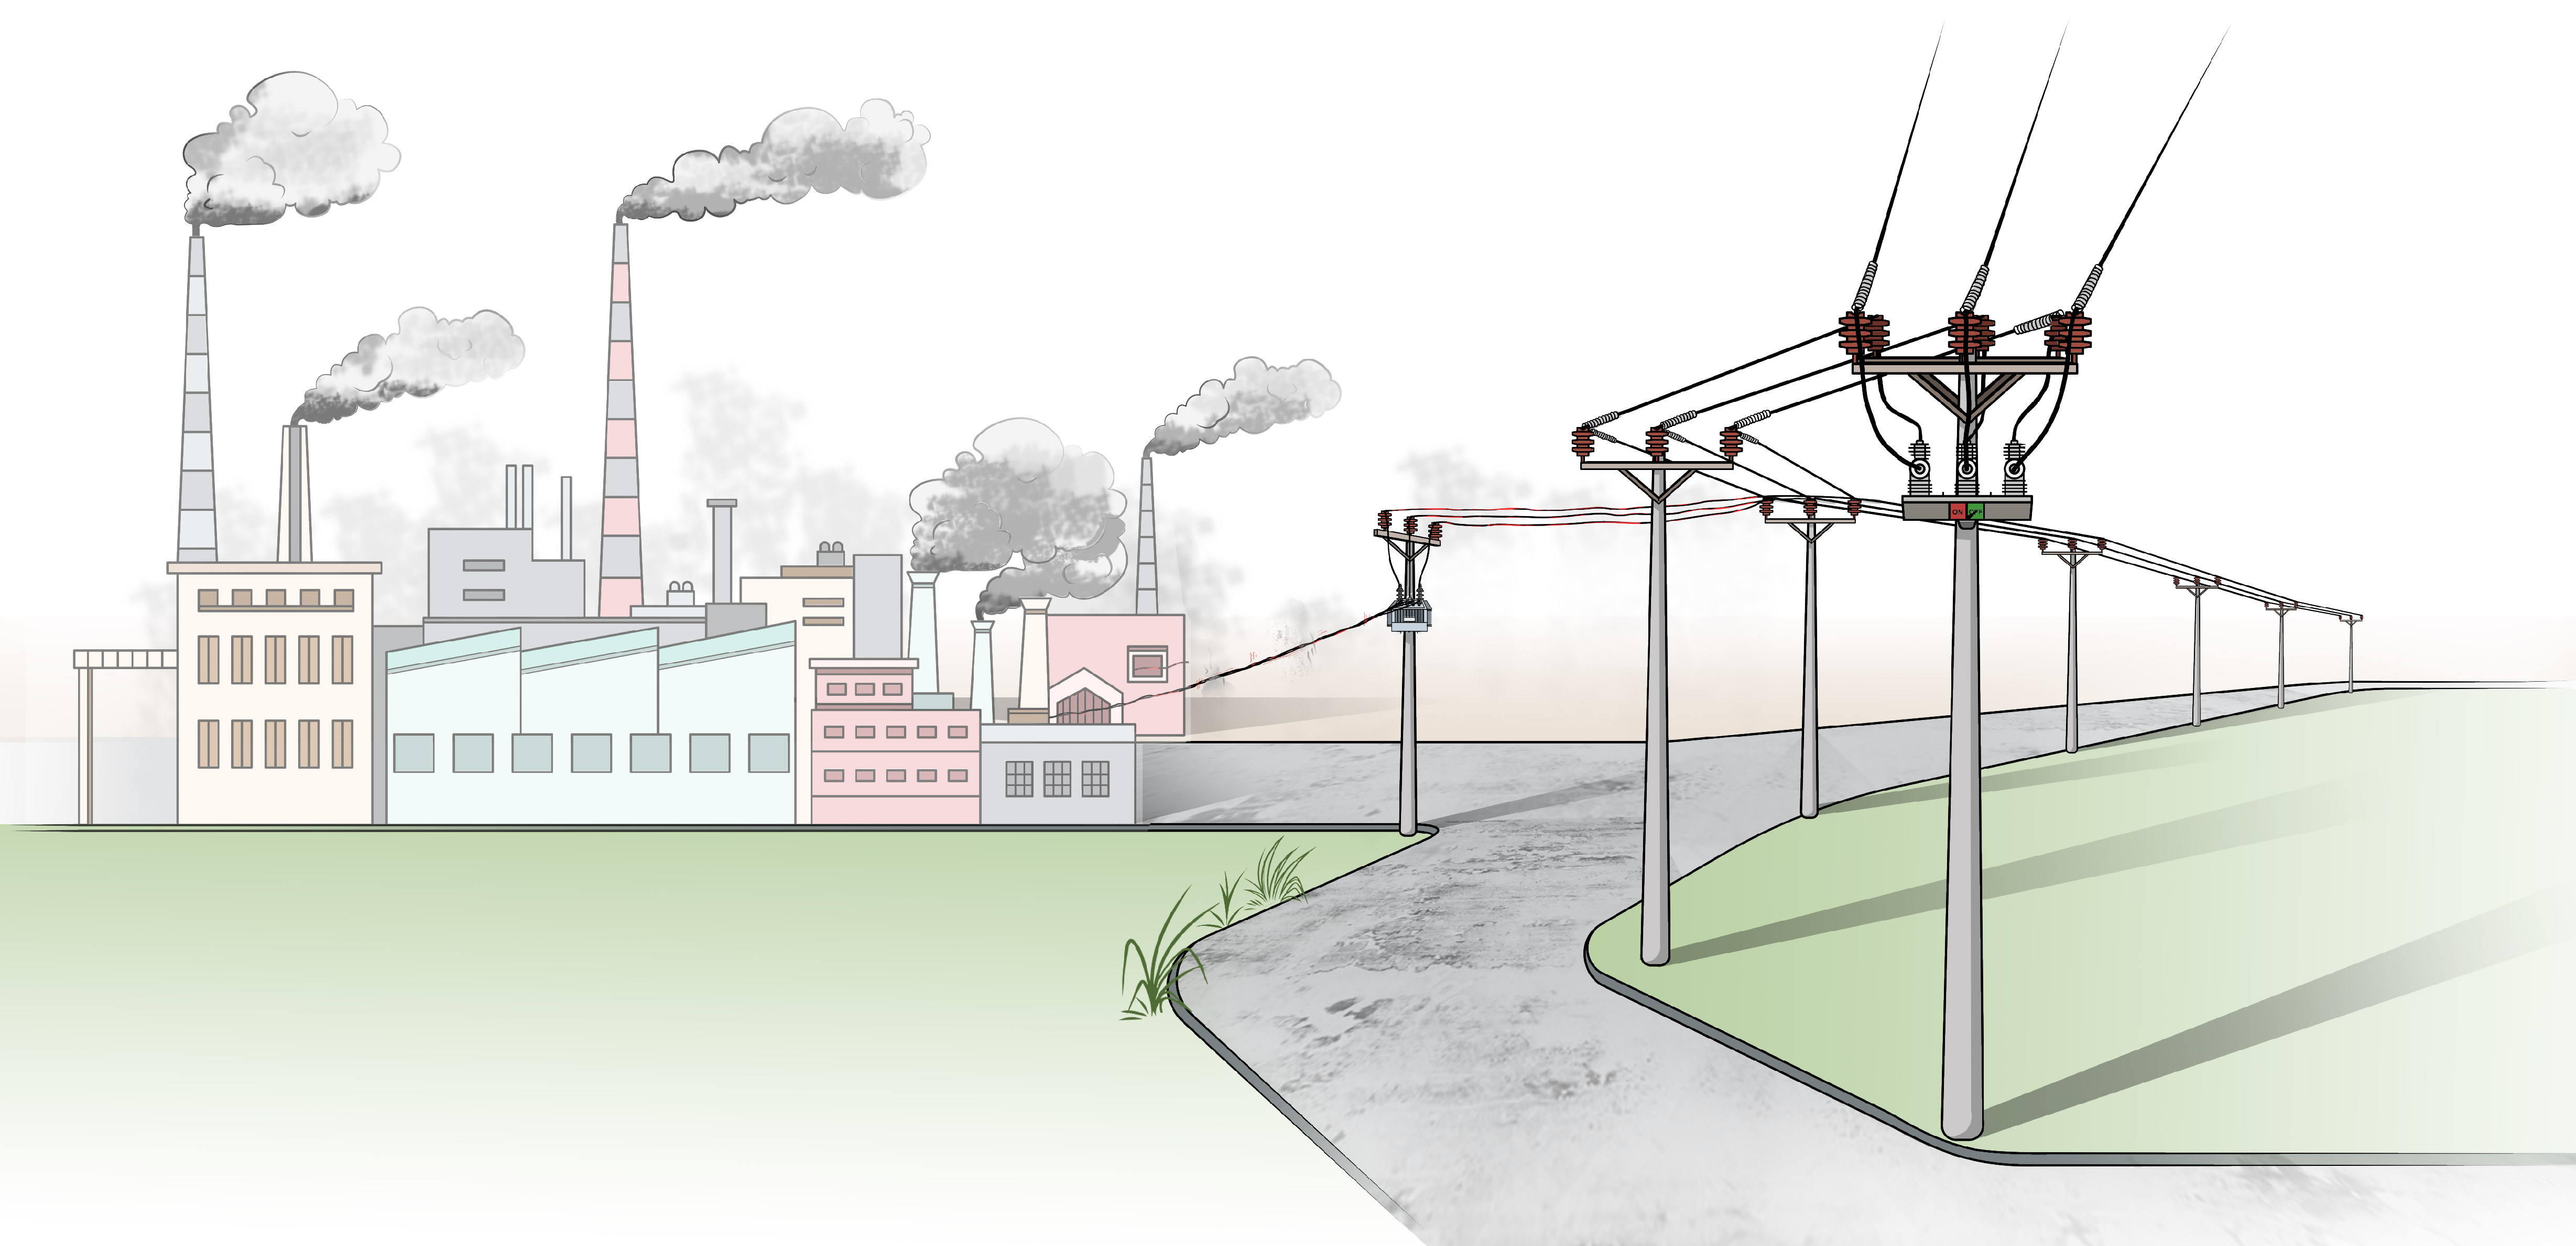
OVERVIEW OF POWER-GRID INFRASTRUCTURE
Before we get into the technicalities of faults on distribution lines, it's important to revisit the standard infrastructure of the power grid from energy generation to transmission before we dive deeper into the problems and solutions associated downstream at the energy distribution grid level.
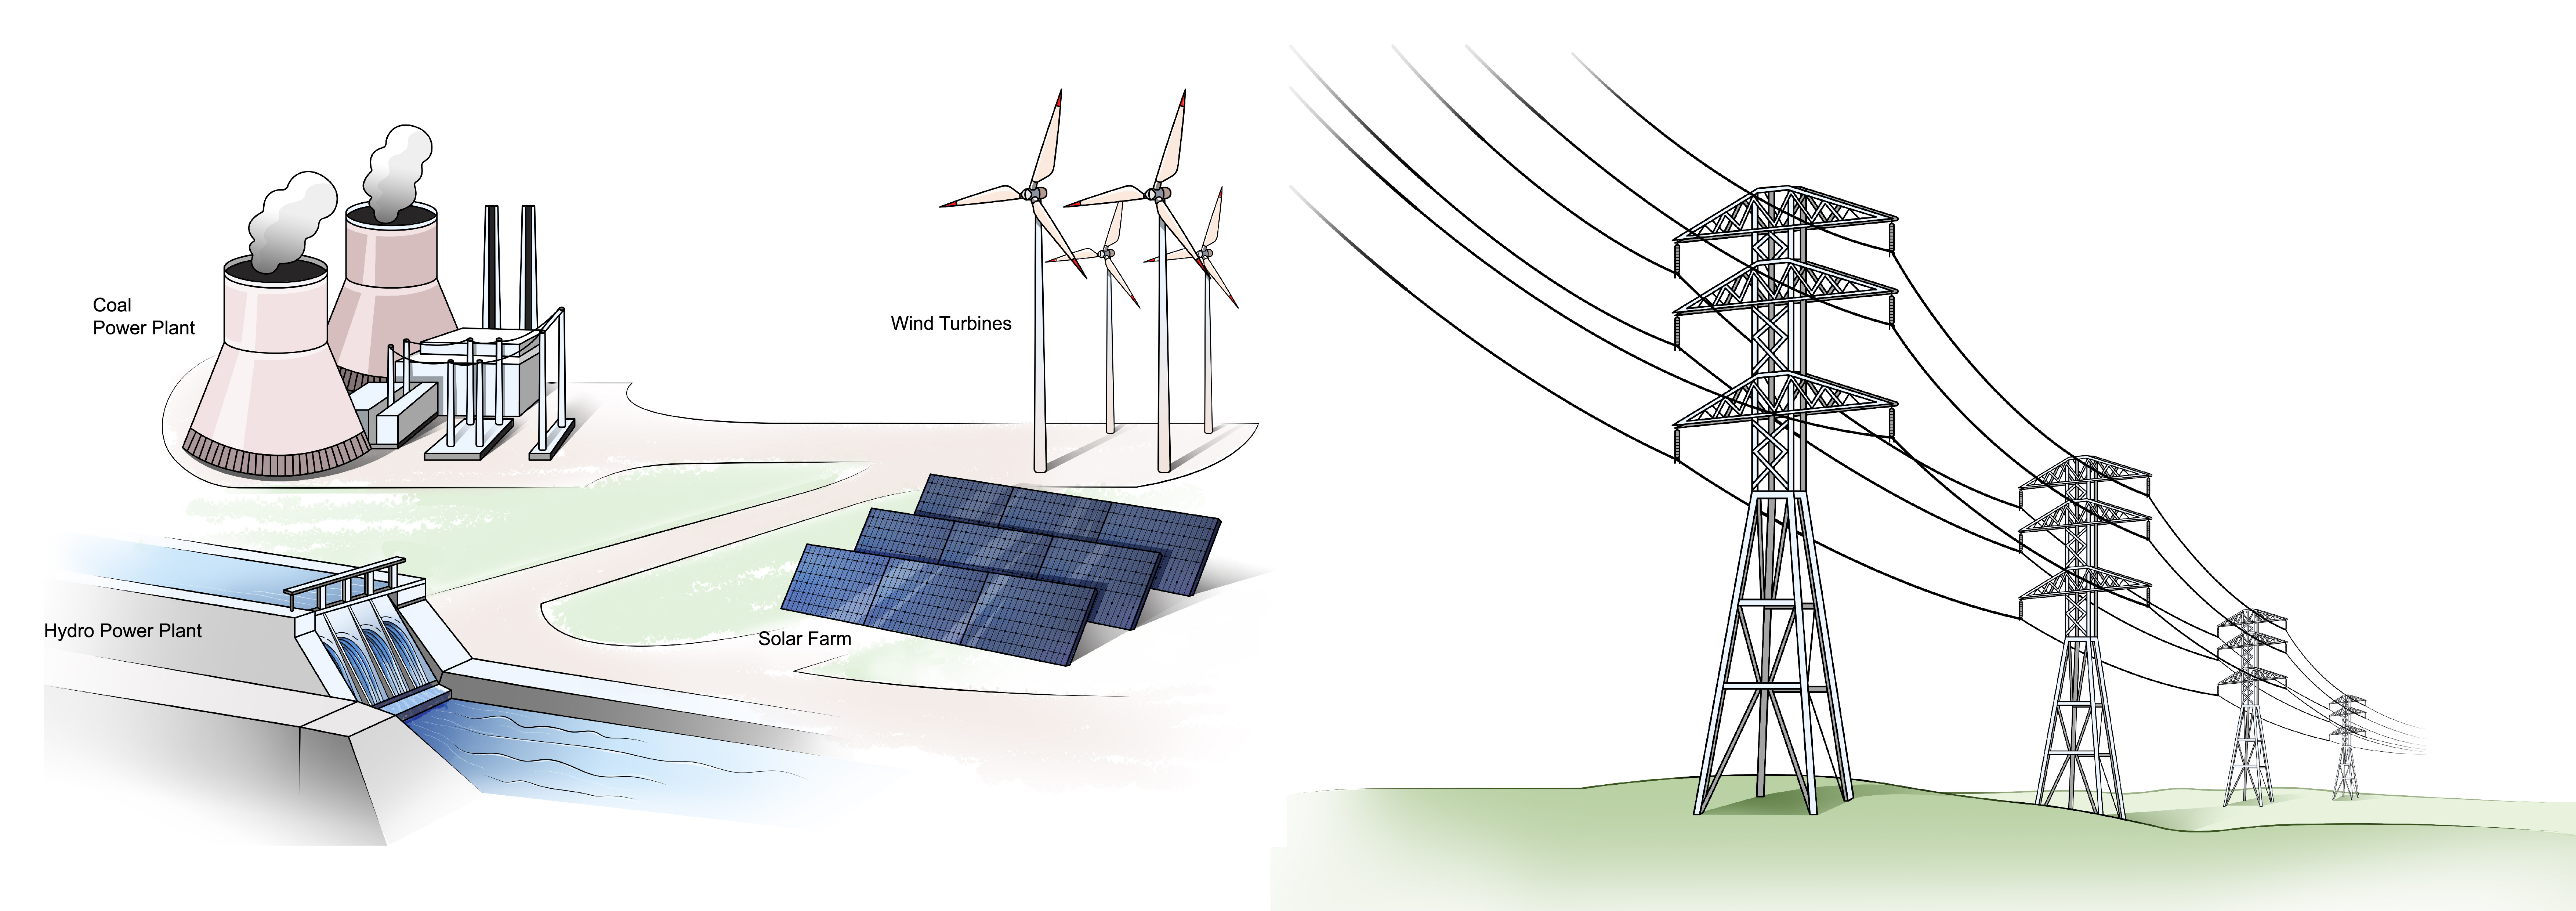
(Power Generation) ⇒ (Power Transmission)
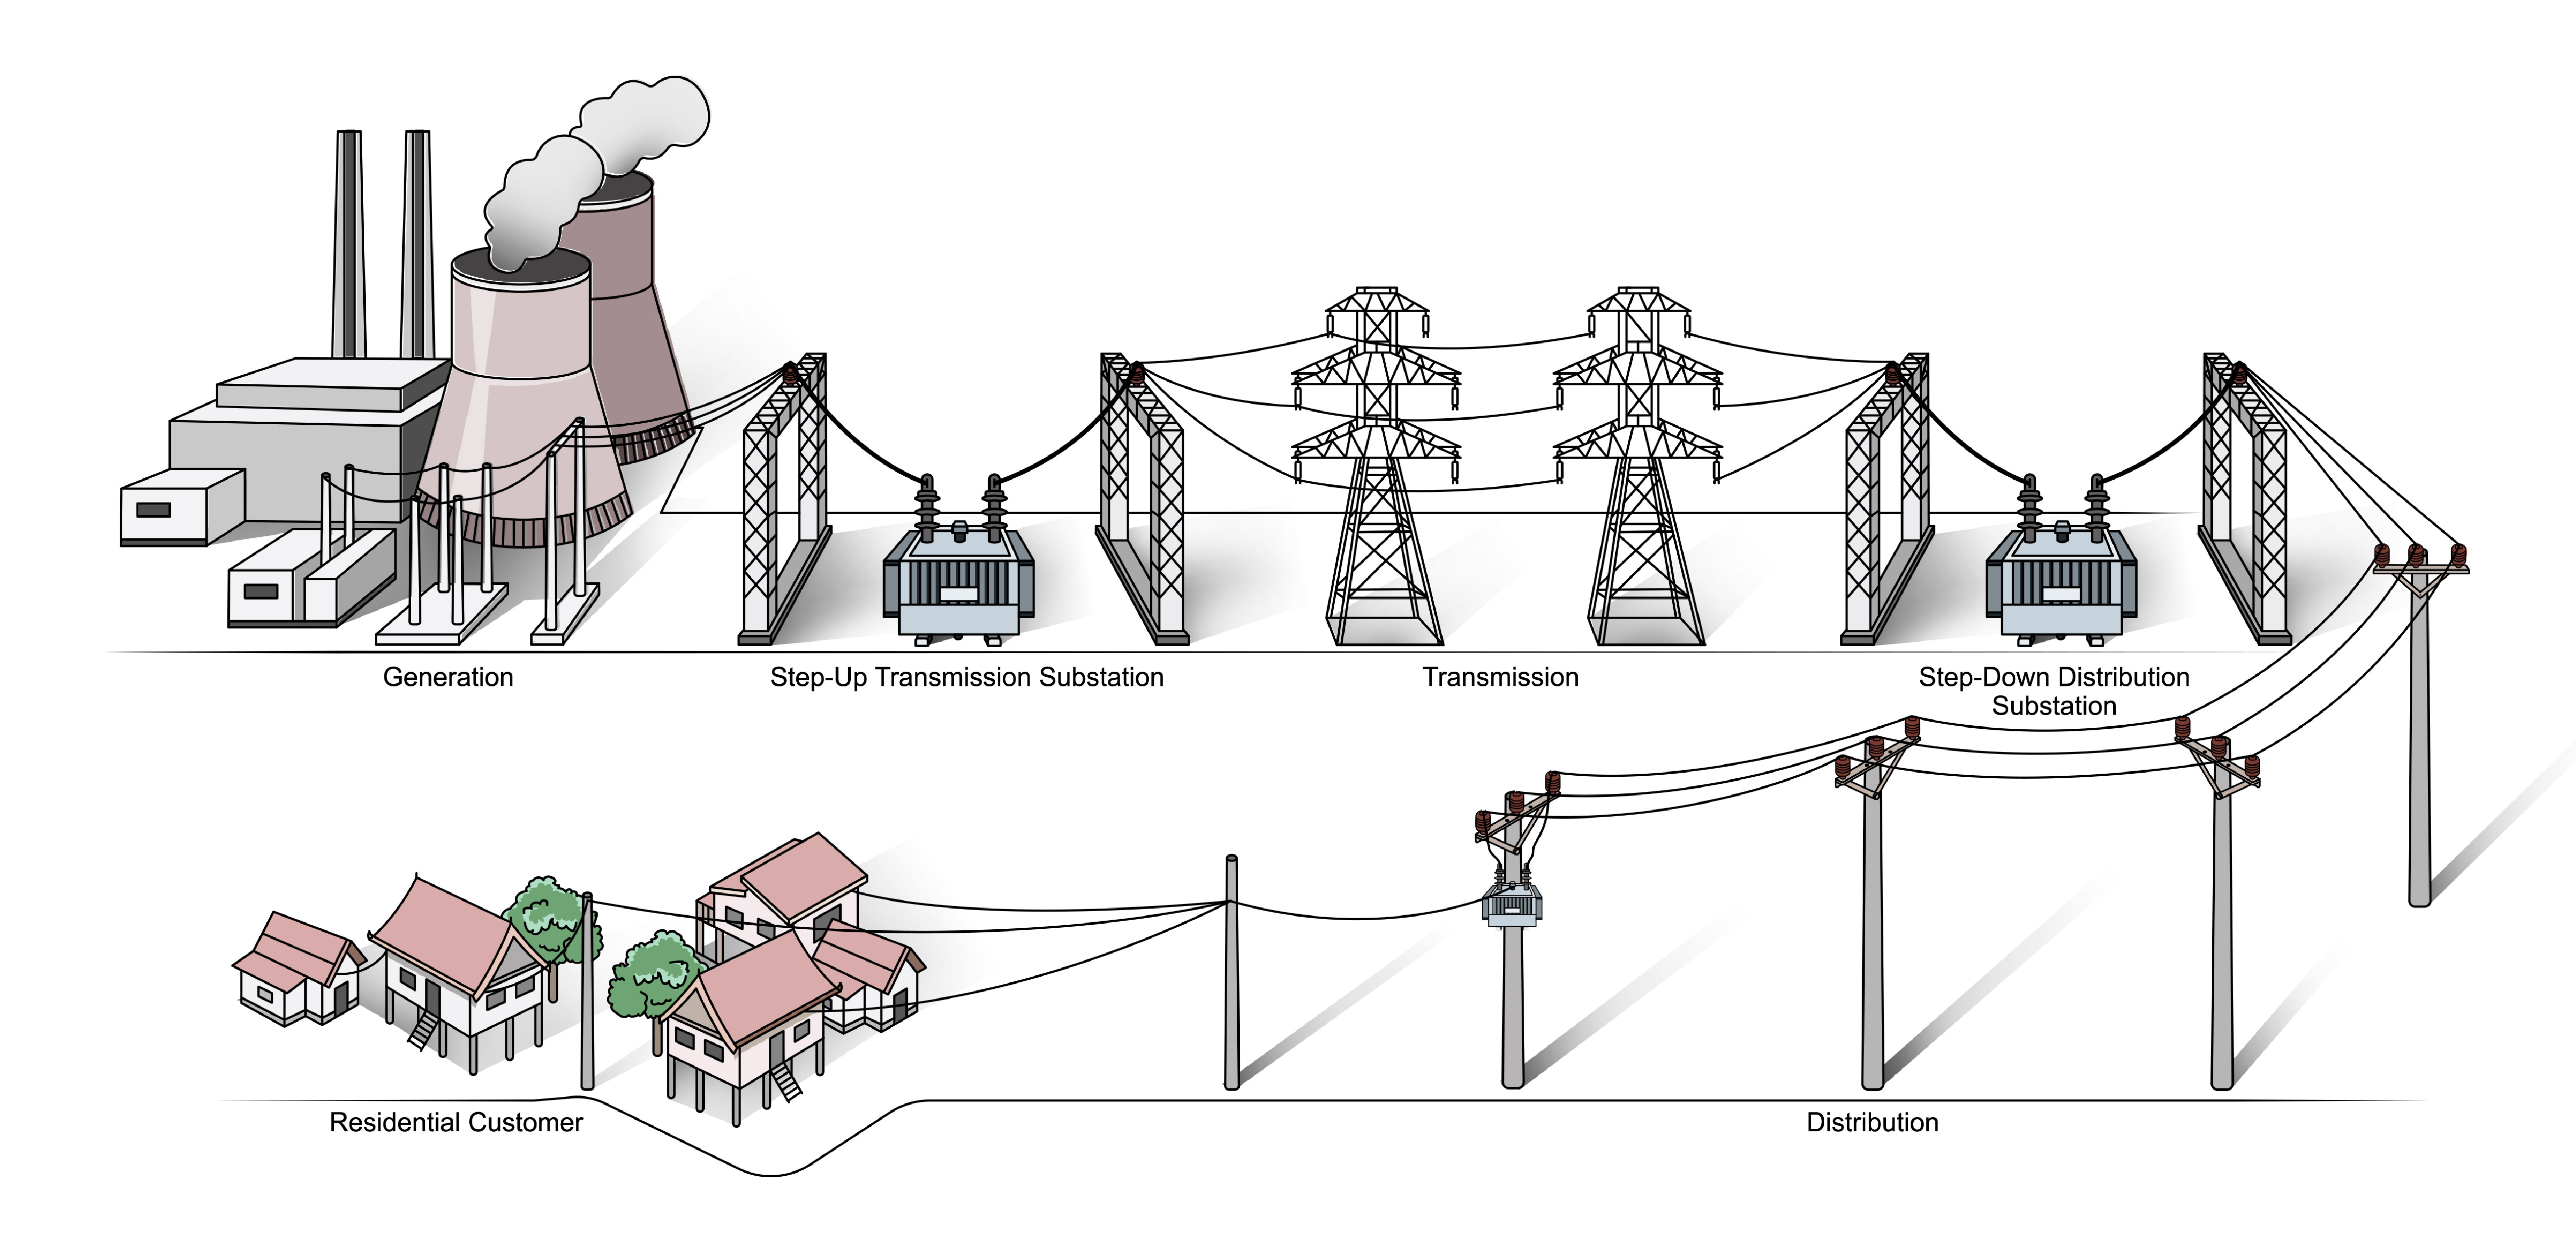 The illustration above simplifies the power grid from generation down to consumption level.
TYPES OF FAULTS ON DISTRIBUTION LINES
After power has been generated and delivered downstream over long distances through transmission lines to a grid-substation. The grid-substation, distribution substations along with other relevant power-systems and equipment will further distribute and convert power from its incumbent state of high-voltage to medium voltage (as per requirement) of various types of grid-connected customers such as households, businesses, factories and manufacturers etc each with varying load requirements and needs to operate.
At the distribution-grid level, this is where certain issues can arise as the distribution of energy is already a complex but delicate load balancing act between power generation, power supply, power distribution and eventually the management of power consumption. After over 100 years since Thomas Edison’s first power-grid in New York city, the distribution grid today is only expected to get further complexed and is in dire need of smarter data-driven and automation technologies such as DERs (Distributed Energy Resources), renewables. This coupled with increasing appetites for power consumption are pushing the traditional power-grid and its traditionals means of management to evolve for better.
In Cambodia and most developing economies’ energy markets, the following issues are common:
NON-COMPLIANCE WITH IEC STANDARDS
Developing economies face a dilemma or moreso, an opportunity cost between focusing their resources and investments on rapidly developing much-needed power infrastructure versus the implementation and enforcement of international standard policies on all aspects of electrical, electronic and related technologies. Normally this should go hand in hand simultaneously but this is seldom the case.
International standards, such as those developed and published by the International Electro-technical Commission (IEC) are seldom adhered to in developing economies which can cause a range of problems over time. Before we continue, it is important to note that the founding purpose of the IEC is to standardize all applications of “electrotechnologies” amongst its members around the world by deliberating upon, developing and publishing standards on subjects such as for example; The design standards for transmission lines, their recommended length, insulation requirements, nominal voltage and current levels etc. To certify that they are compliant and most importantly, safe for operation within their environments.
Public power regulatory authorities also play an important role in this regard by ensuring that their respective energy sectors and the stakeholders within their framework also abide by these internationally renowned standards. Responsibility of enforcement of these standards is normally placed upon the shoulders of power regulatory authorities within their respective jurisdictions of control or in some cases, country-wide.
Unfortunately, this is a common challenge within rapidly developing economies where this issue is a mixture of a lack of technical-know how, urgency to develop much needed critical public power-infrastructure and the insufficient or non-existent monitoring and enforcement of higher technical standards by relevant authorities. These are hurdles that are much needed to be overcome through a unison and holistic approach by relevant stakeholders by underlining the long-term economic and potential risks to prospects of industries and human lives due to non-adherence to international standards.
Cambodia, like most rapidly developing nations, faces these issues. Hence, it’s not uncommon for consumers to face low quality or unstable power in addition to exposure of electric utility maintenance crews to life-threatening accidents which can be attributed to non-compliance of IEC standards. This can be the majority of the case whenever power-grid issues arise and crews are dispatched on-site to rectify problems.
POWER LOSS DUE TO INEXACT COMPONENTS SUCH AS INSULATION & LENGTH OF MV OVERHEAD LINES
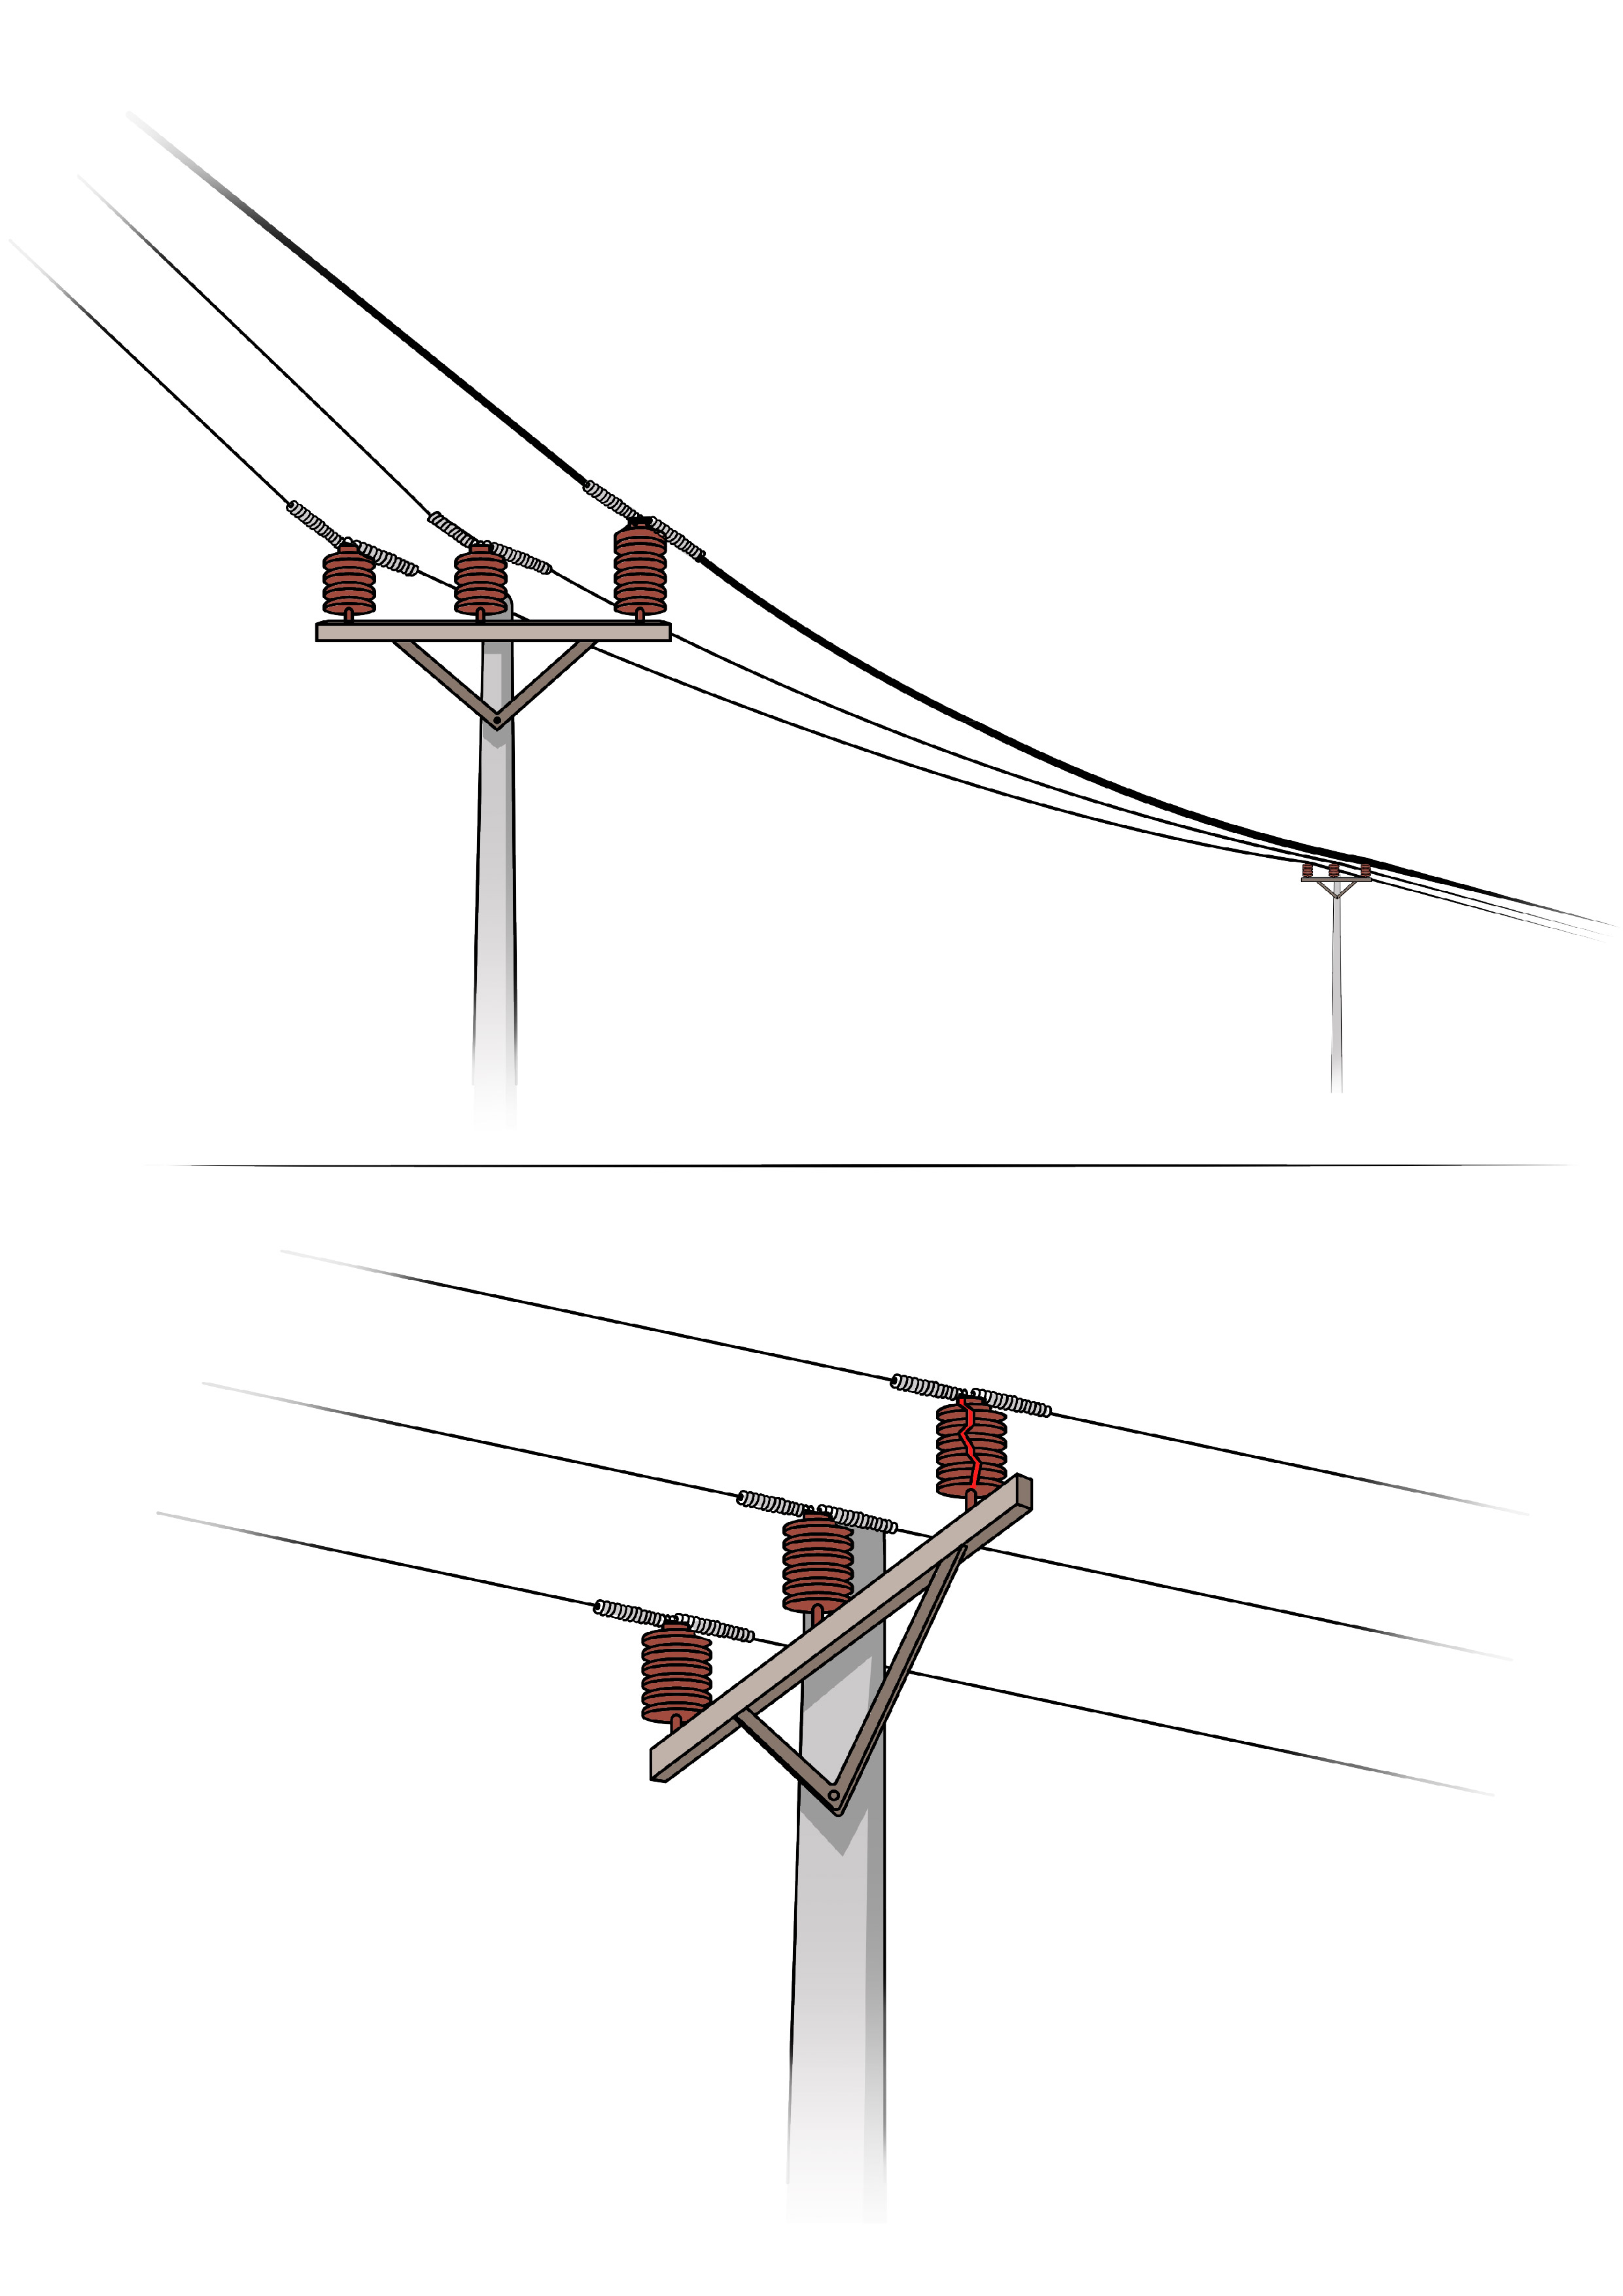
There are a combination of reasons that can lead to power loss. In these specific cases, irregularities in the length of overhead lines and insultation especially in rural areas is especially common throughout Cambodia.
When such problem arises due to the length of the overhead line being out of the recommended technical parameters or specifications, then this is directly attributed to non-compliance with recommended technical standards (IEC, ISO and other relevant guidelines). Insulation is also usually found to be lacking due to damage of a pin insulator on the electrical post or use of lower quality materials due to either mismanagement of budgets by electric utilities or lack of quality consistency by certain vendors.
As a result, downstream consumers would face power loss or unreliable electricity (low-quality power) being supplied to their homes or businesses. This, in turn can also directly affect the asset life of their machinery, electrical appliances and overall business. In some cases, improper insulation can also lead to serious injury to humans or animals as well as the increased risk of loss of life due to incidents such as an “arc-flash''.
HIGH LEVELS OF LOAD, OVERLOADING AND POWER LOSS DUE TO CERTAIN CUSTOMERS
High levels of power loads can cause further overloading on an already overloaded power line and result in further worsening overall power quality being supplied. As such, grid operators need to consider the higher capacity load needed by certain customers with higher minimum consumption thresholds such as manufacturing and commercial scale businesses when designing and allocating resources on the grid.
Such technical considerations on point of “load capacity” is key to ensuring that each business can operate their heavy machinery or high-power load-dependent assets smoothly, efficiently and without interruption. This would ensure their cash-flows are also optimized as a direct cause of better resource planning management by grid operators. In sum, this issue causes excessive over-loading on the grid and tips the balance between supply and demand to unsustainable levels in terms of both; 1. Maintaining optimal operational benchmarks and 2. Financial losses borne by all due to a poorly planned distribution grid system.
LACK OF INFORMATION OR MEANS TO GATHER DATA.
As we play our part in grid-modernization through the development of smart-grid systems, data, has always played an integral role in supporting policy makers, resource planning management and utility operators to make better decisions. Efficiency on this part, translates to efficiency across energy systems and ultimately a financial bottom line that is sustainable. The first key challenge is to establish a means of collecting and monitoring key or critical data, and then to “control” where possible and necessary. 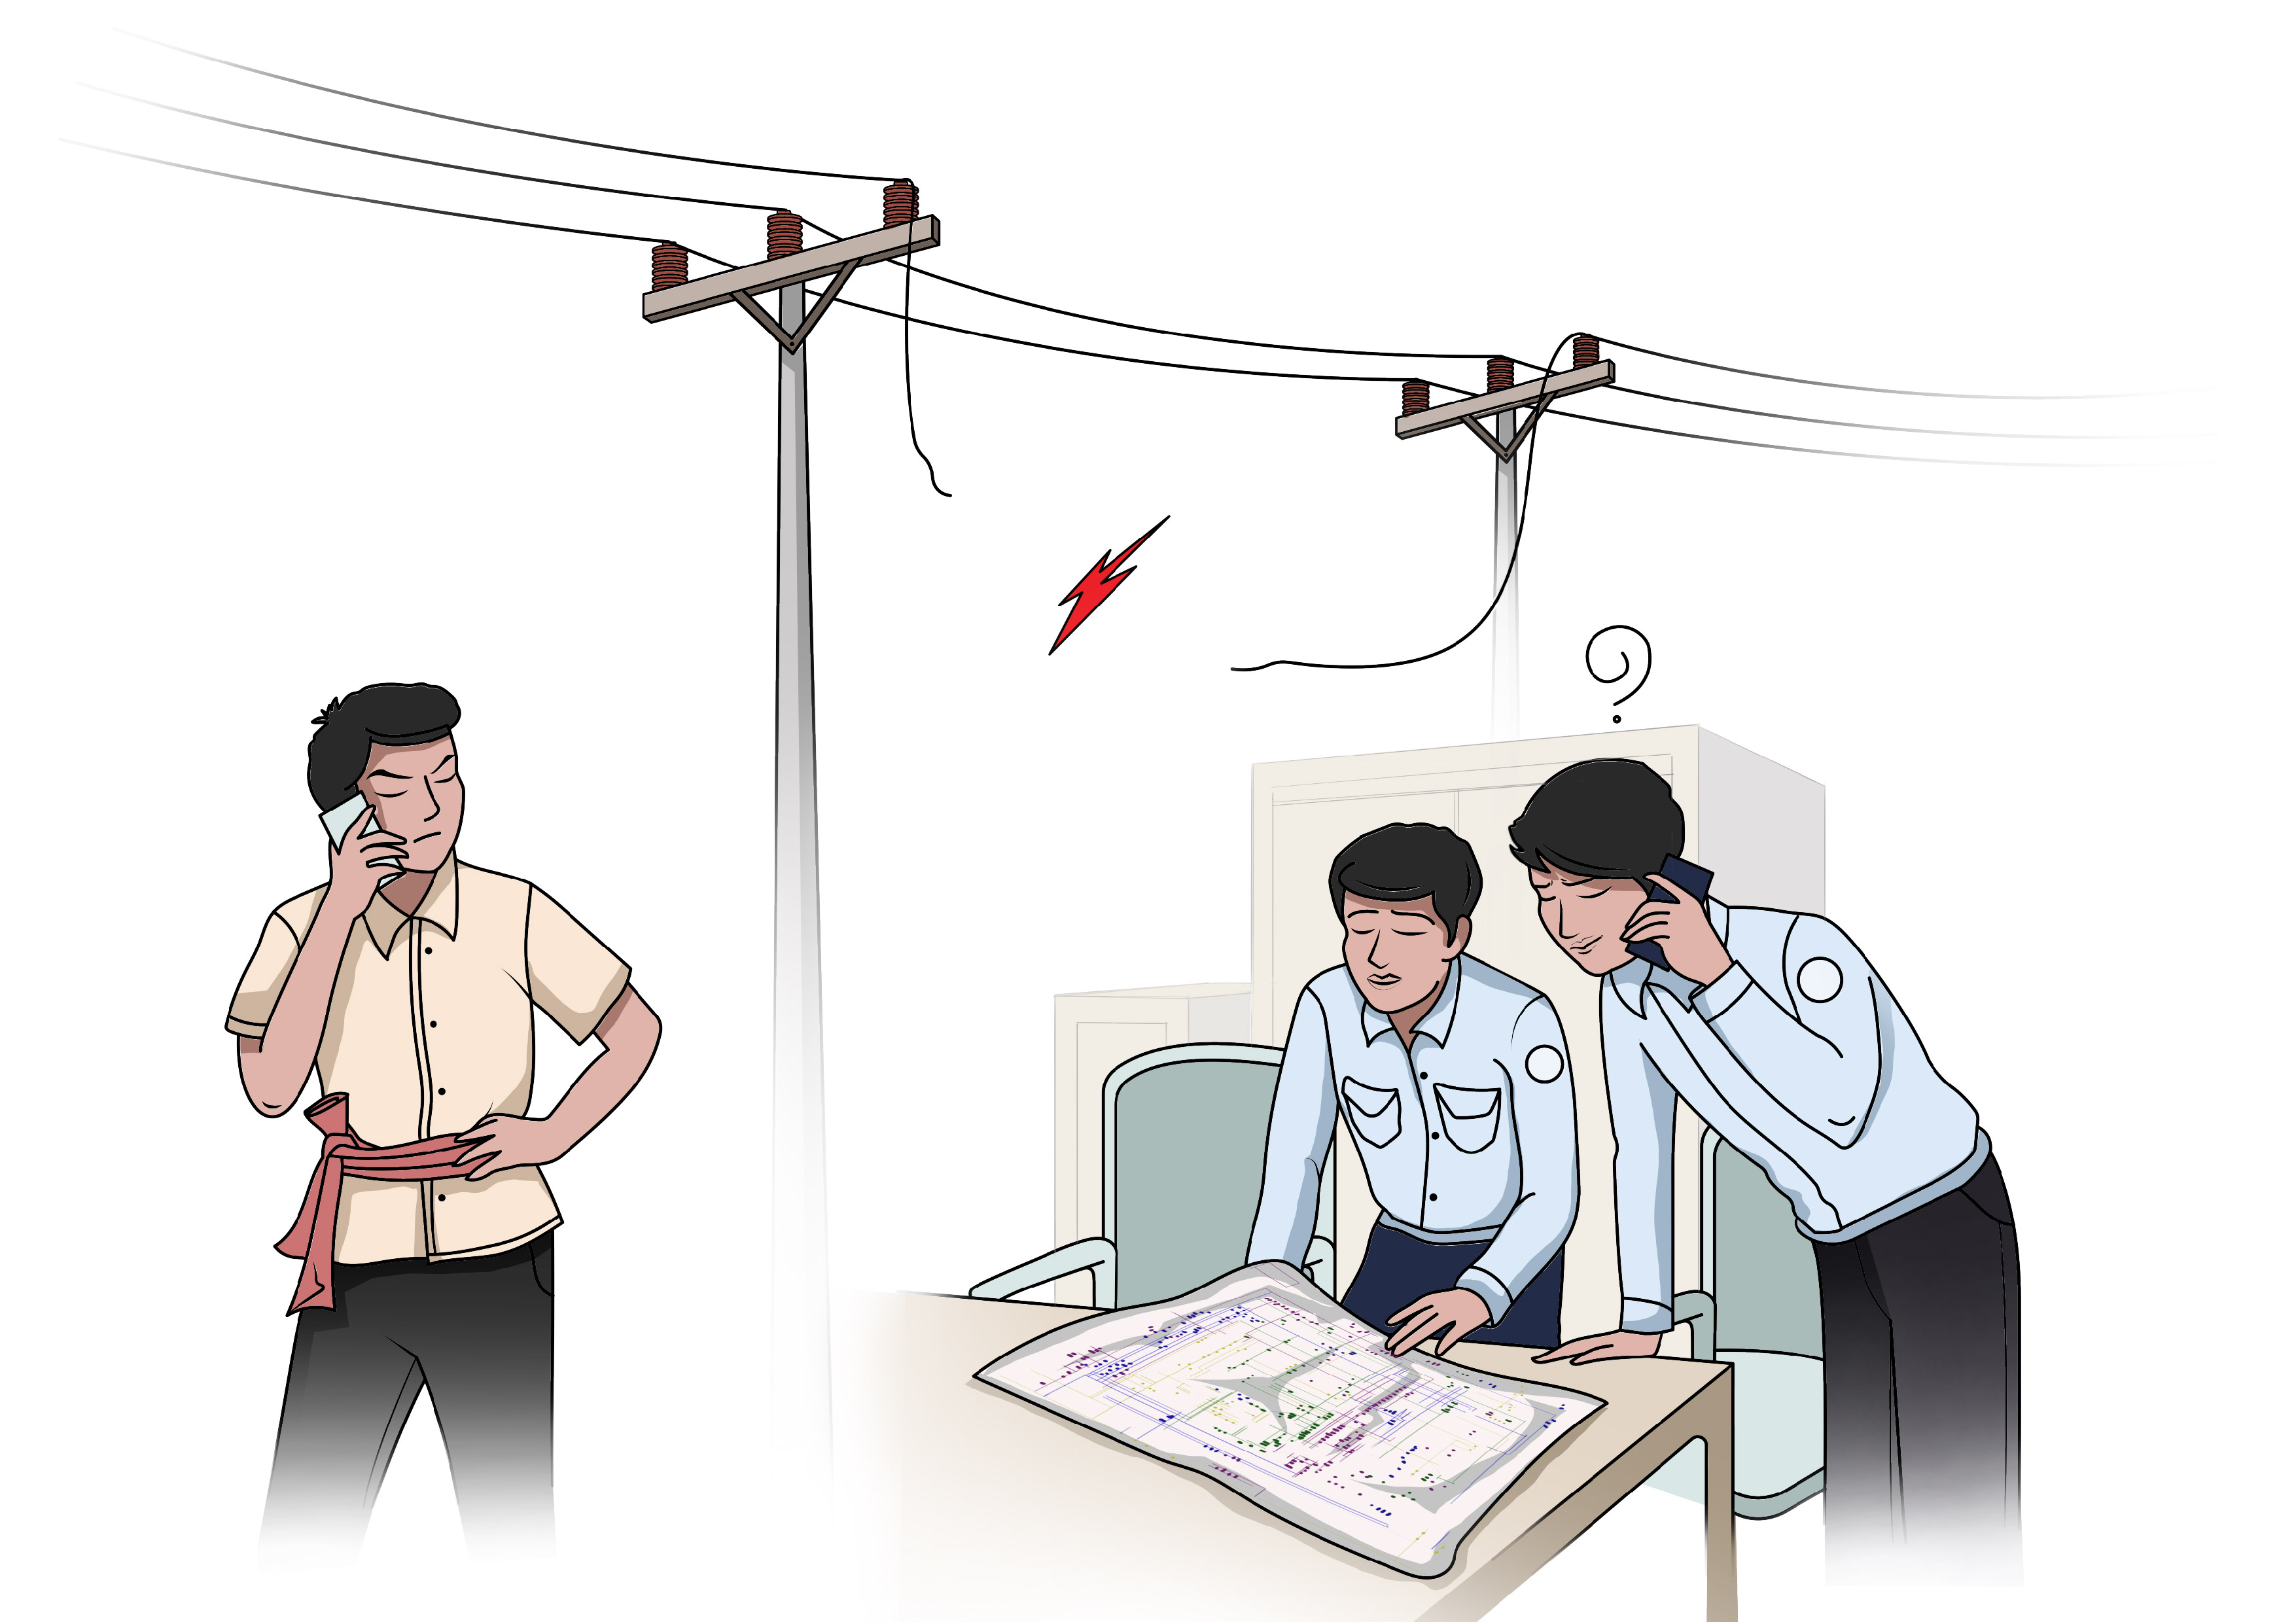
Control or actuating capabilities is situation specific depending on requirements, site-location and moreover, upon grid assets already commissioned as one of the points our team takes into consideration when working closely with electric utility operators to understand their needs and consult appropriately. Already commissioned equipment such as an auto-recloser, load-break switch, fuse-saver, sectionalizers, meters etc across the power-grid, grid-substations, distribution-substations etc are crucial to lookout for.
Without a SCADA (Supervisory Control And Data-Acquisition System) or remote control capabilities enabled by IoT (Internet of Things) or IIoT (Industrial Internet of Things) devices and technologies. Then, the primary task of data-collection becomes an ever more cumbersome and manual task due to lack of technology upgradation or deployment (Digitalization). Across the power-grid, data collection and monitoring is especially vital to grid-operators. In terms of energy metering or data-collection, most tier 1 hardware providers that have been well established in the market since decades and have already supplied energy metering or monitoring solutions. However, much needed functionality such as; automated reporting, remote communication and data-transfer capabilities are lacking as legacy systems tend to be decades old and expensive to upgrade and maintain to newer versions. In addition, affordability and customizability amongst different hardware brands (ABB, Hitachi, SEL, Siemens, Schneider etc) onto a single dashboard or SCADA platform (PC or Smart-Phone App) is also not possible due to technical challenges. A key challenge our team has overcome through our offerings and solutions. This moot-point is also due to maintaining brand-integrity and to cement one’s position as a single vendor for all existing and future needs of an electric utility. Hence, this can be costly and time consuming as overhaul of existing systems and assets are usually proposed by a single corporate vendor where the approach is always standardized. This can be for good reasons, of course, but needs and scenarios tend to always be unique, as is the case in developing countries like Cambodia.
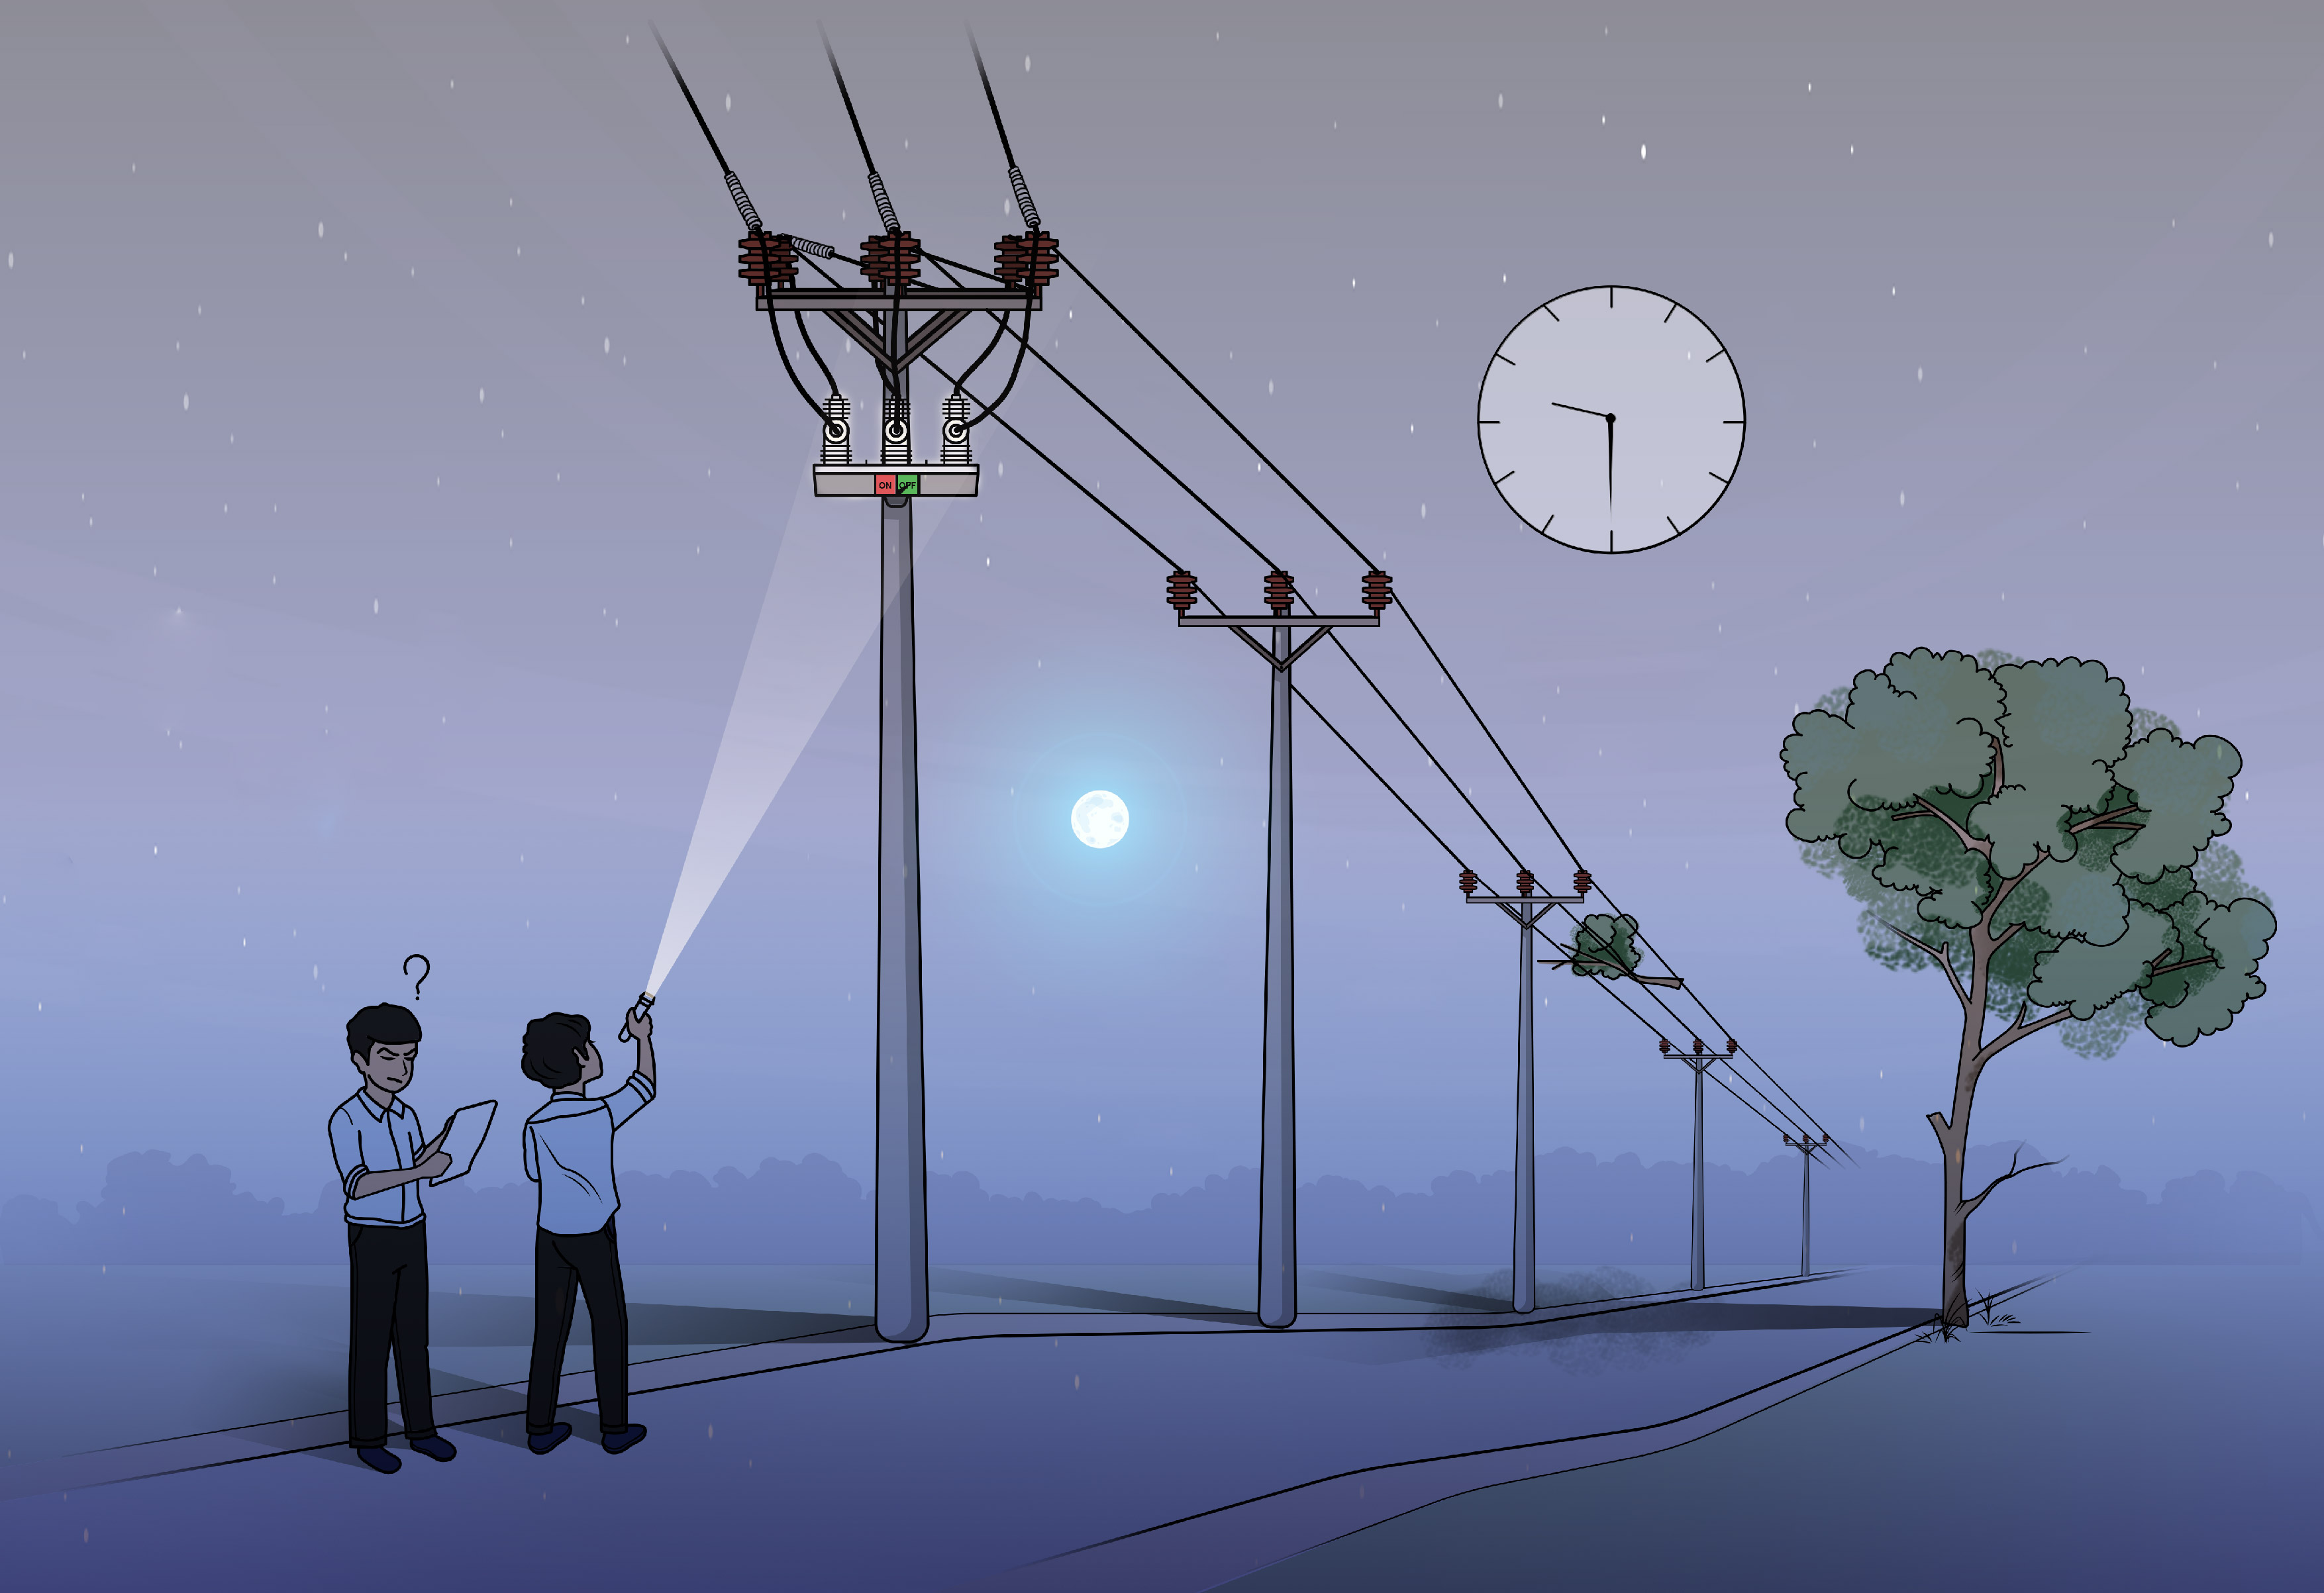
Hence, without appropriate, timely and accurate data-collection of the power-system, there are no efficient means of data-analysis and forecasting for grid-operators to benefit from. Even, in typical cases, throughout developing countries where a rural electric utility’s only means of data-collection is dependent upon gathering information or feedback via telephone or instant-messaging apps as is observed in Cambodia. Nonetheless, data is still being collected late and may be inaccurate. Furthermore, if an individual or electric utility is required to travel, they might find themselves travelling long distances or into regions that can become inaccessible due to torrential rain or dangerous road conditions, particularly during the monsoon or rainy season in certain countries. This is particularly, the case during rainy seasons along the remote border region of Cambodia, Laos, Thailand and Vietnam. An area where high-voltage transmission lines are deployed for power-imports.
In sum, the lack of information or means to gather data is prevalent in developing economies where there are various challenges, gaps to overcome such as technology unavailability (lack of digitalization), affordability of advanced industrial automation systems, scale of customizability, etc to achieve transitions towards higher energy efficiency and cost reductions.
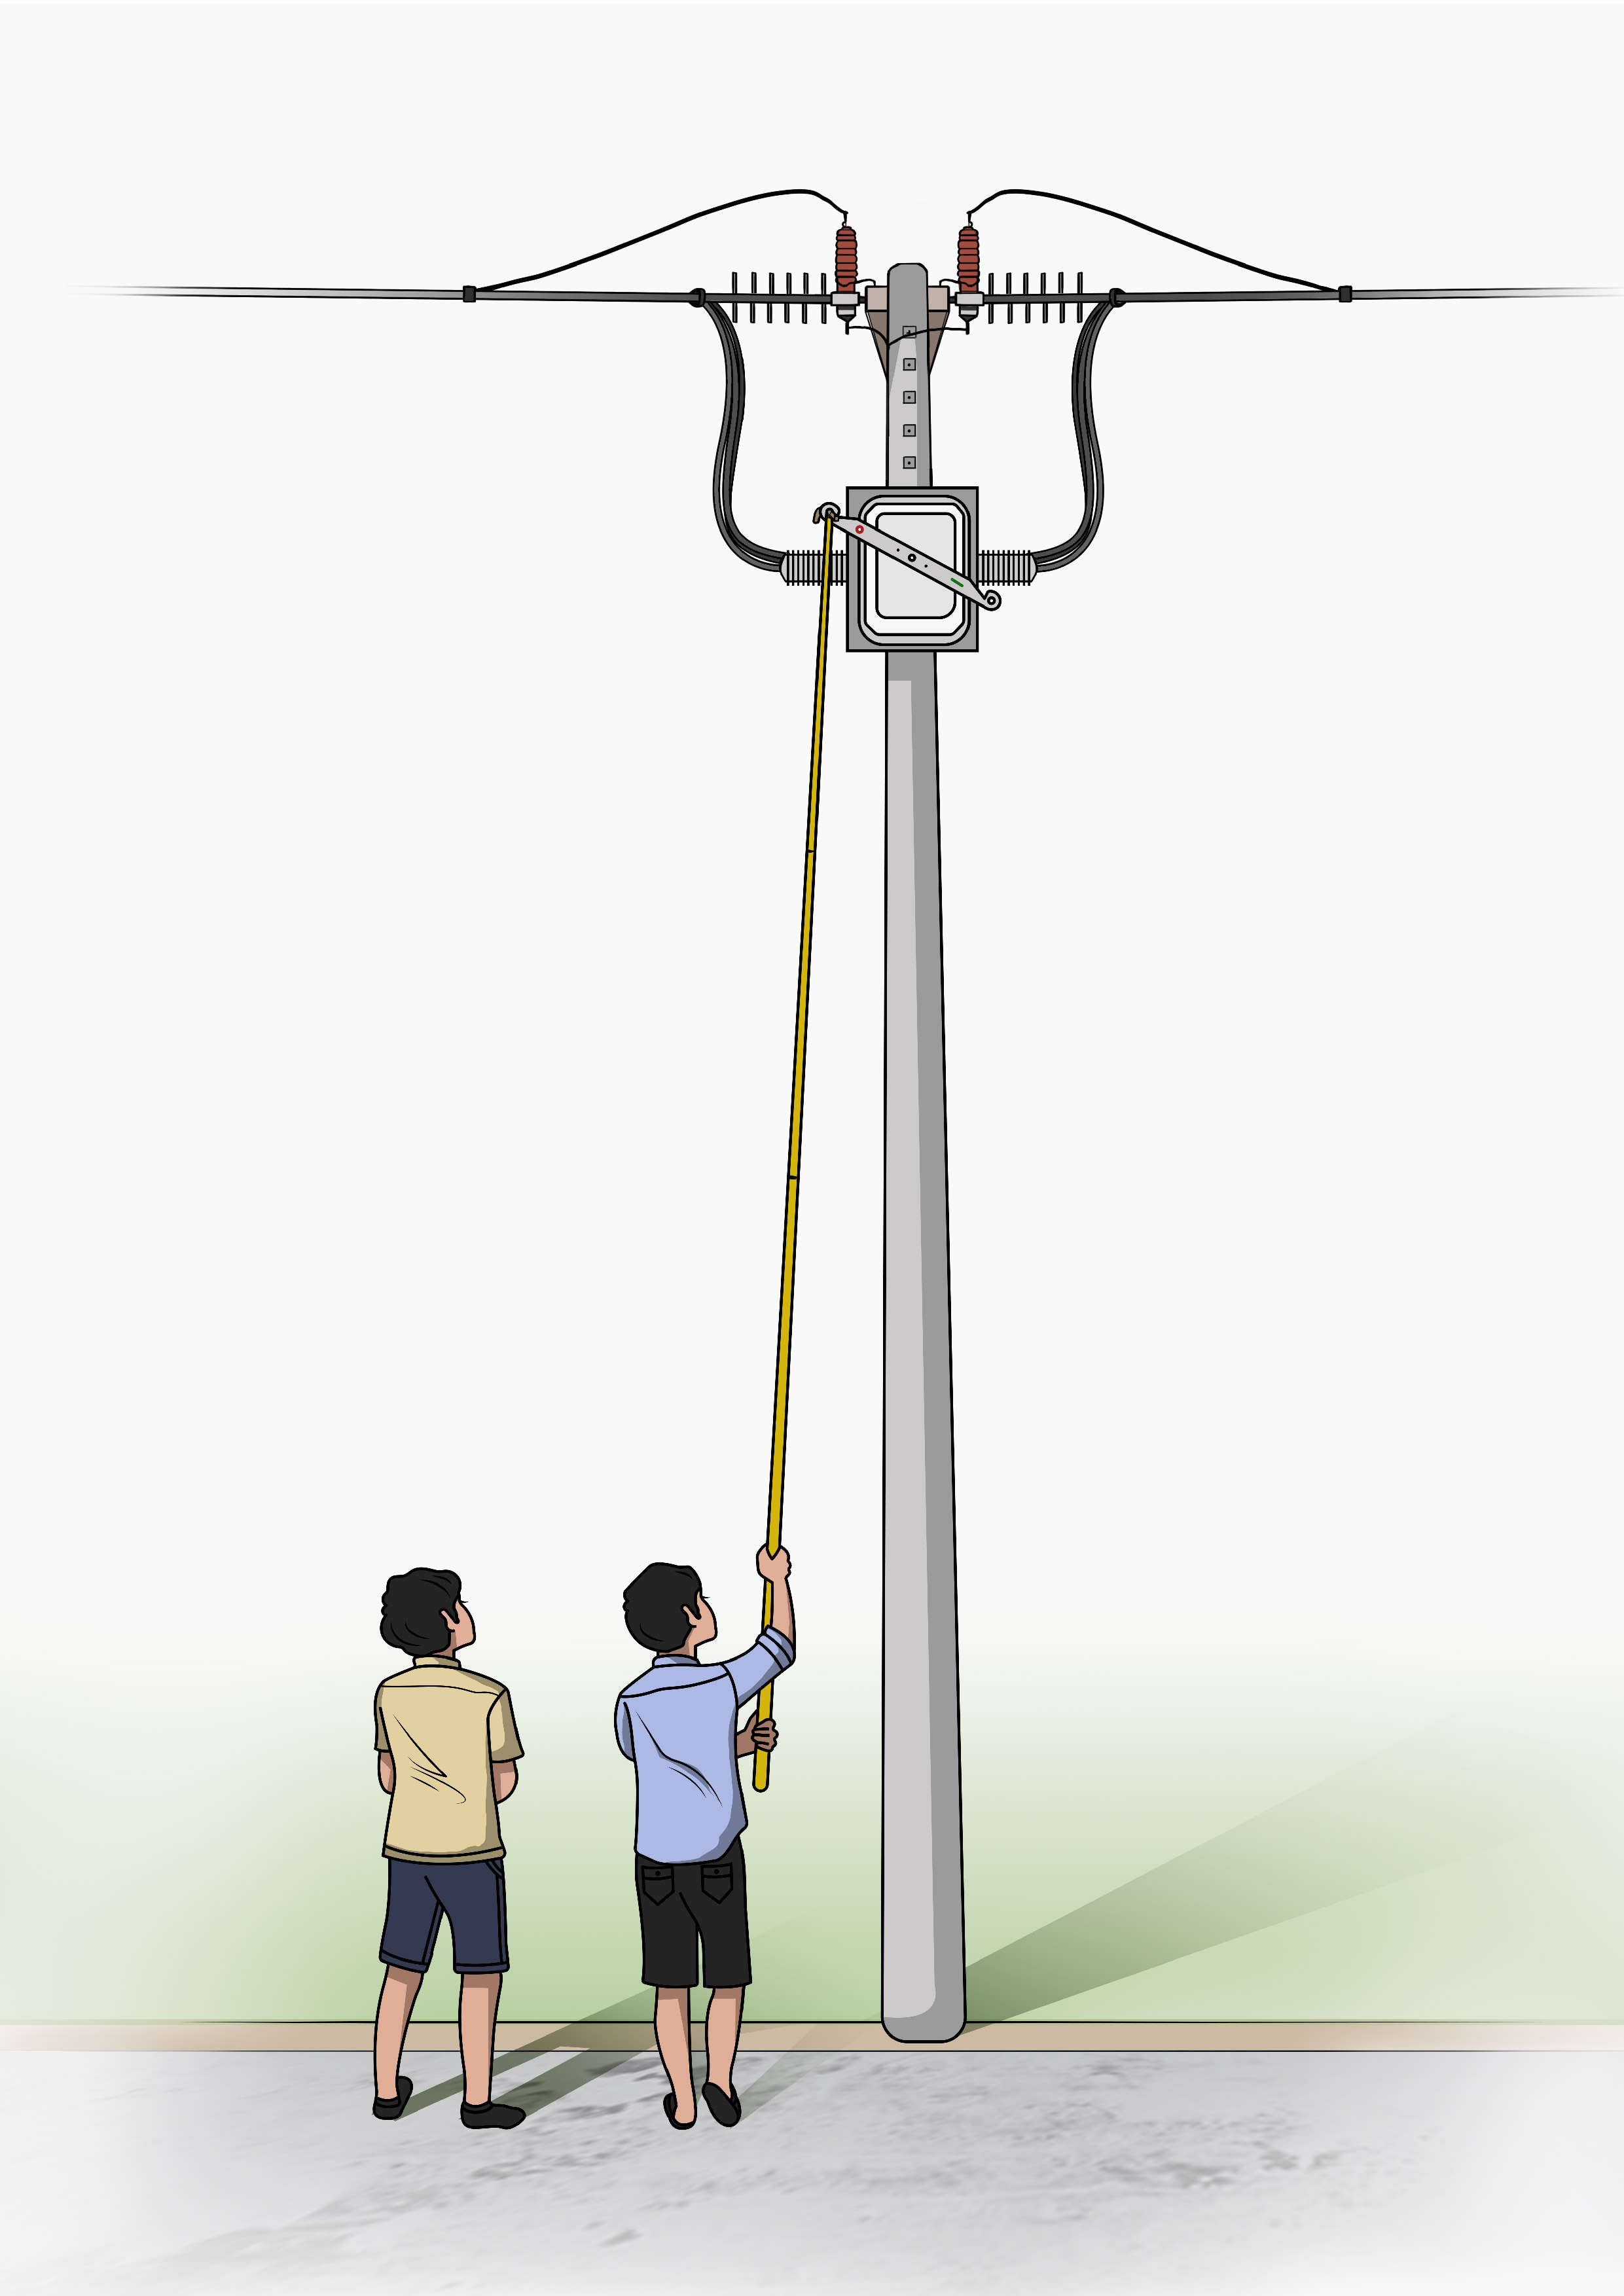
HUMAN ERRORS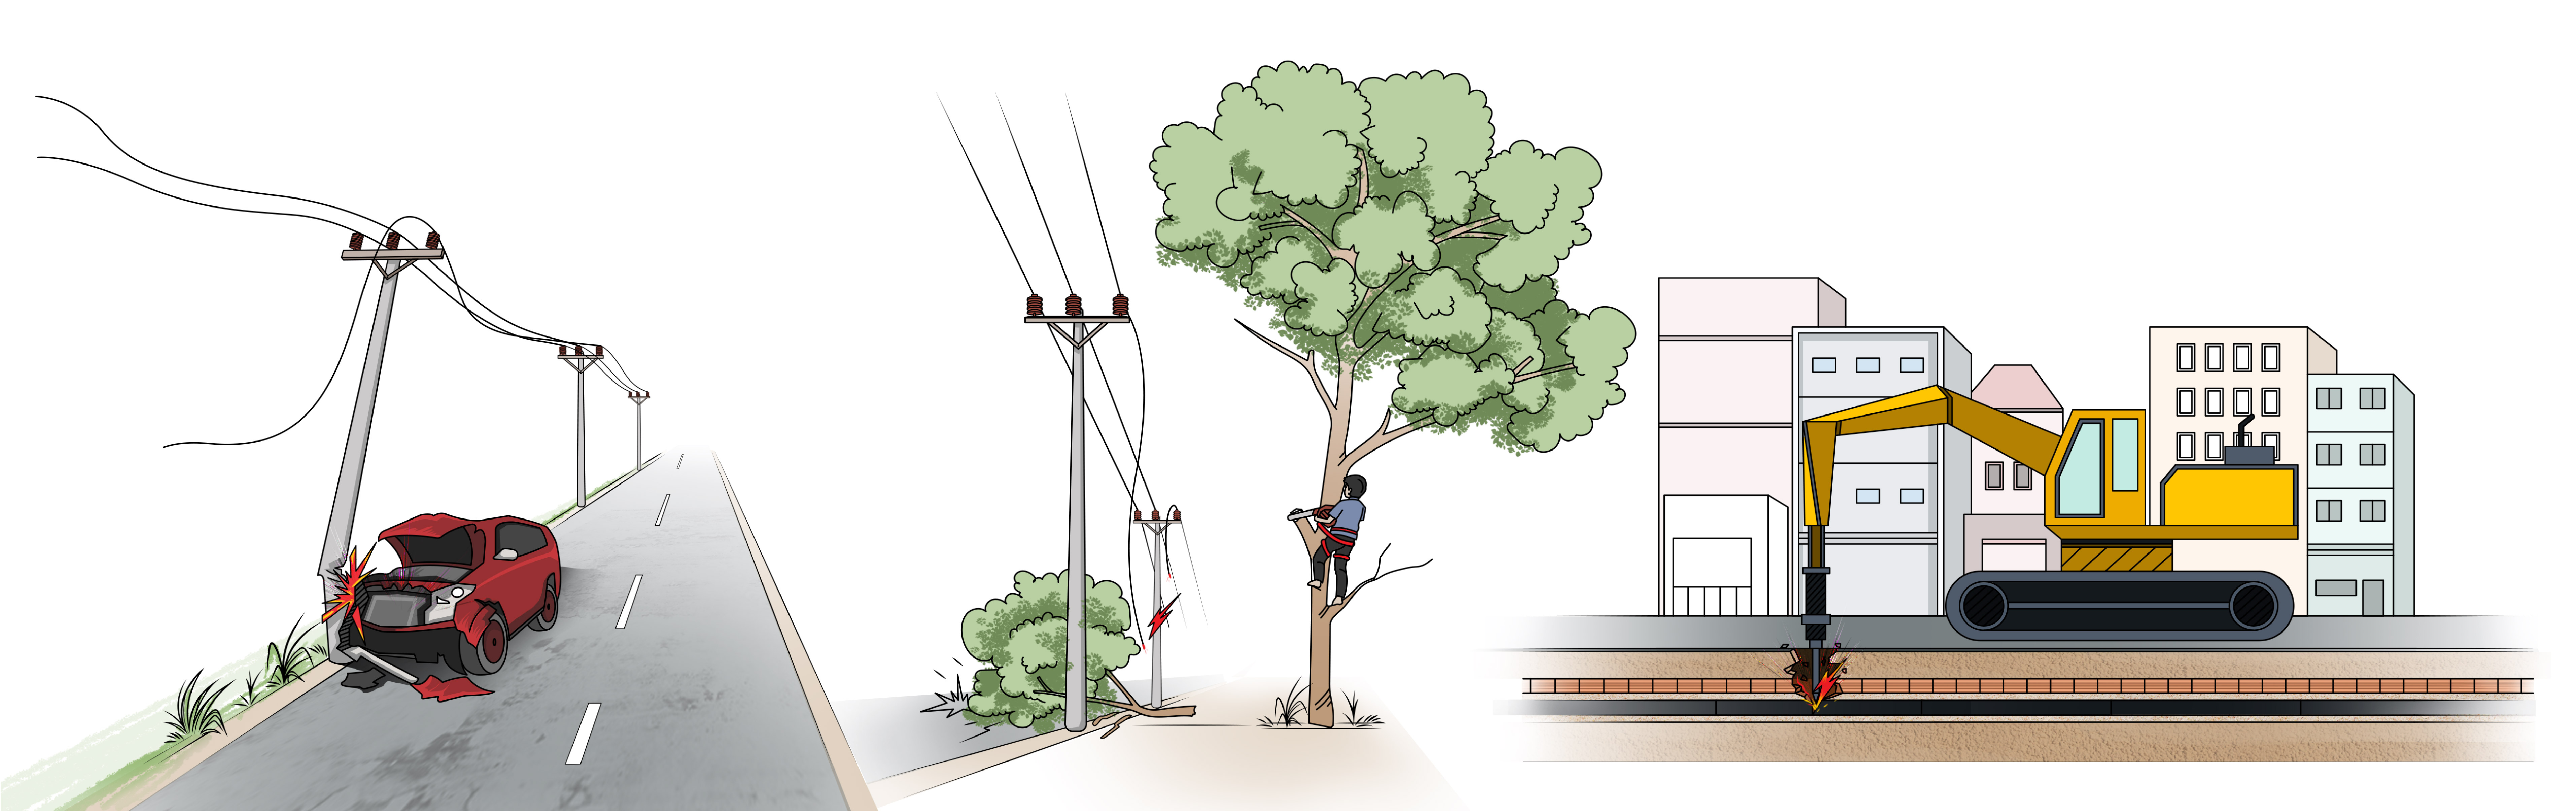
In developing countries like Cambodia, human errors due to the combination of aforementioned factors such as lack of technical know-how, experience, and training gaps are common. Although, much has been done much towards filling these gaps with the help of knowledge transfer and skill-upgradation initiatives led locally or with the support of international development organizations. Still, accidents, fatalities etc due to human errors occur throughout developing countries such as Cambodia. To mitigate this, It is imperative to promote further capacity development by training, knowledge-sharing and at the least, promoting further awareness and understanding of the risks when attempting to maintain energized electrical equipment, servicing faults and commissioning equipment onto the grid. Moreover, there is commonly seen a lack of understanding of basic safety protocols such as appropriate safety gear (Boots, gloves, helmets etc) amongst maintenance teams in developing countries. Although this has improved significantly, there is still more left to be done. Whether it is a debate of provision or not, basic preventive ideas and concepts spread through awareness would be self-propogating and can go a long way in saving precious lives. Especially amongst maintenance teams, technicians etc.
Human errors are also not limited within the power sector, but also extend to others that might interact with power-systems such as stakeholders from construction companies or residents with limited understanding of risks posed by energized electrical systems. For example, often is the case in Cambodia and developing nations where a construction company might wrongly dig near or into a medium voltage-line with an excavator and come into direct contact with a live- power line causing serious injury or fatality in addition to causing power-loss for many that may have been dependent on that power-line.
Similarly, car accidents or landscapers wrongly cutting a tree that may fall onto a power-line or members of a community opening pole mounted cabinet boxes that house ADVCs, meters and other critical electrical equipment can also cause harm to themselves and others. Unfortunately, these human errors are very much prevalent and certainly preventable through furthering initiatives that increase general awareness and education of the risks posed by incorrectly managing power-lines.
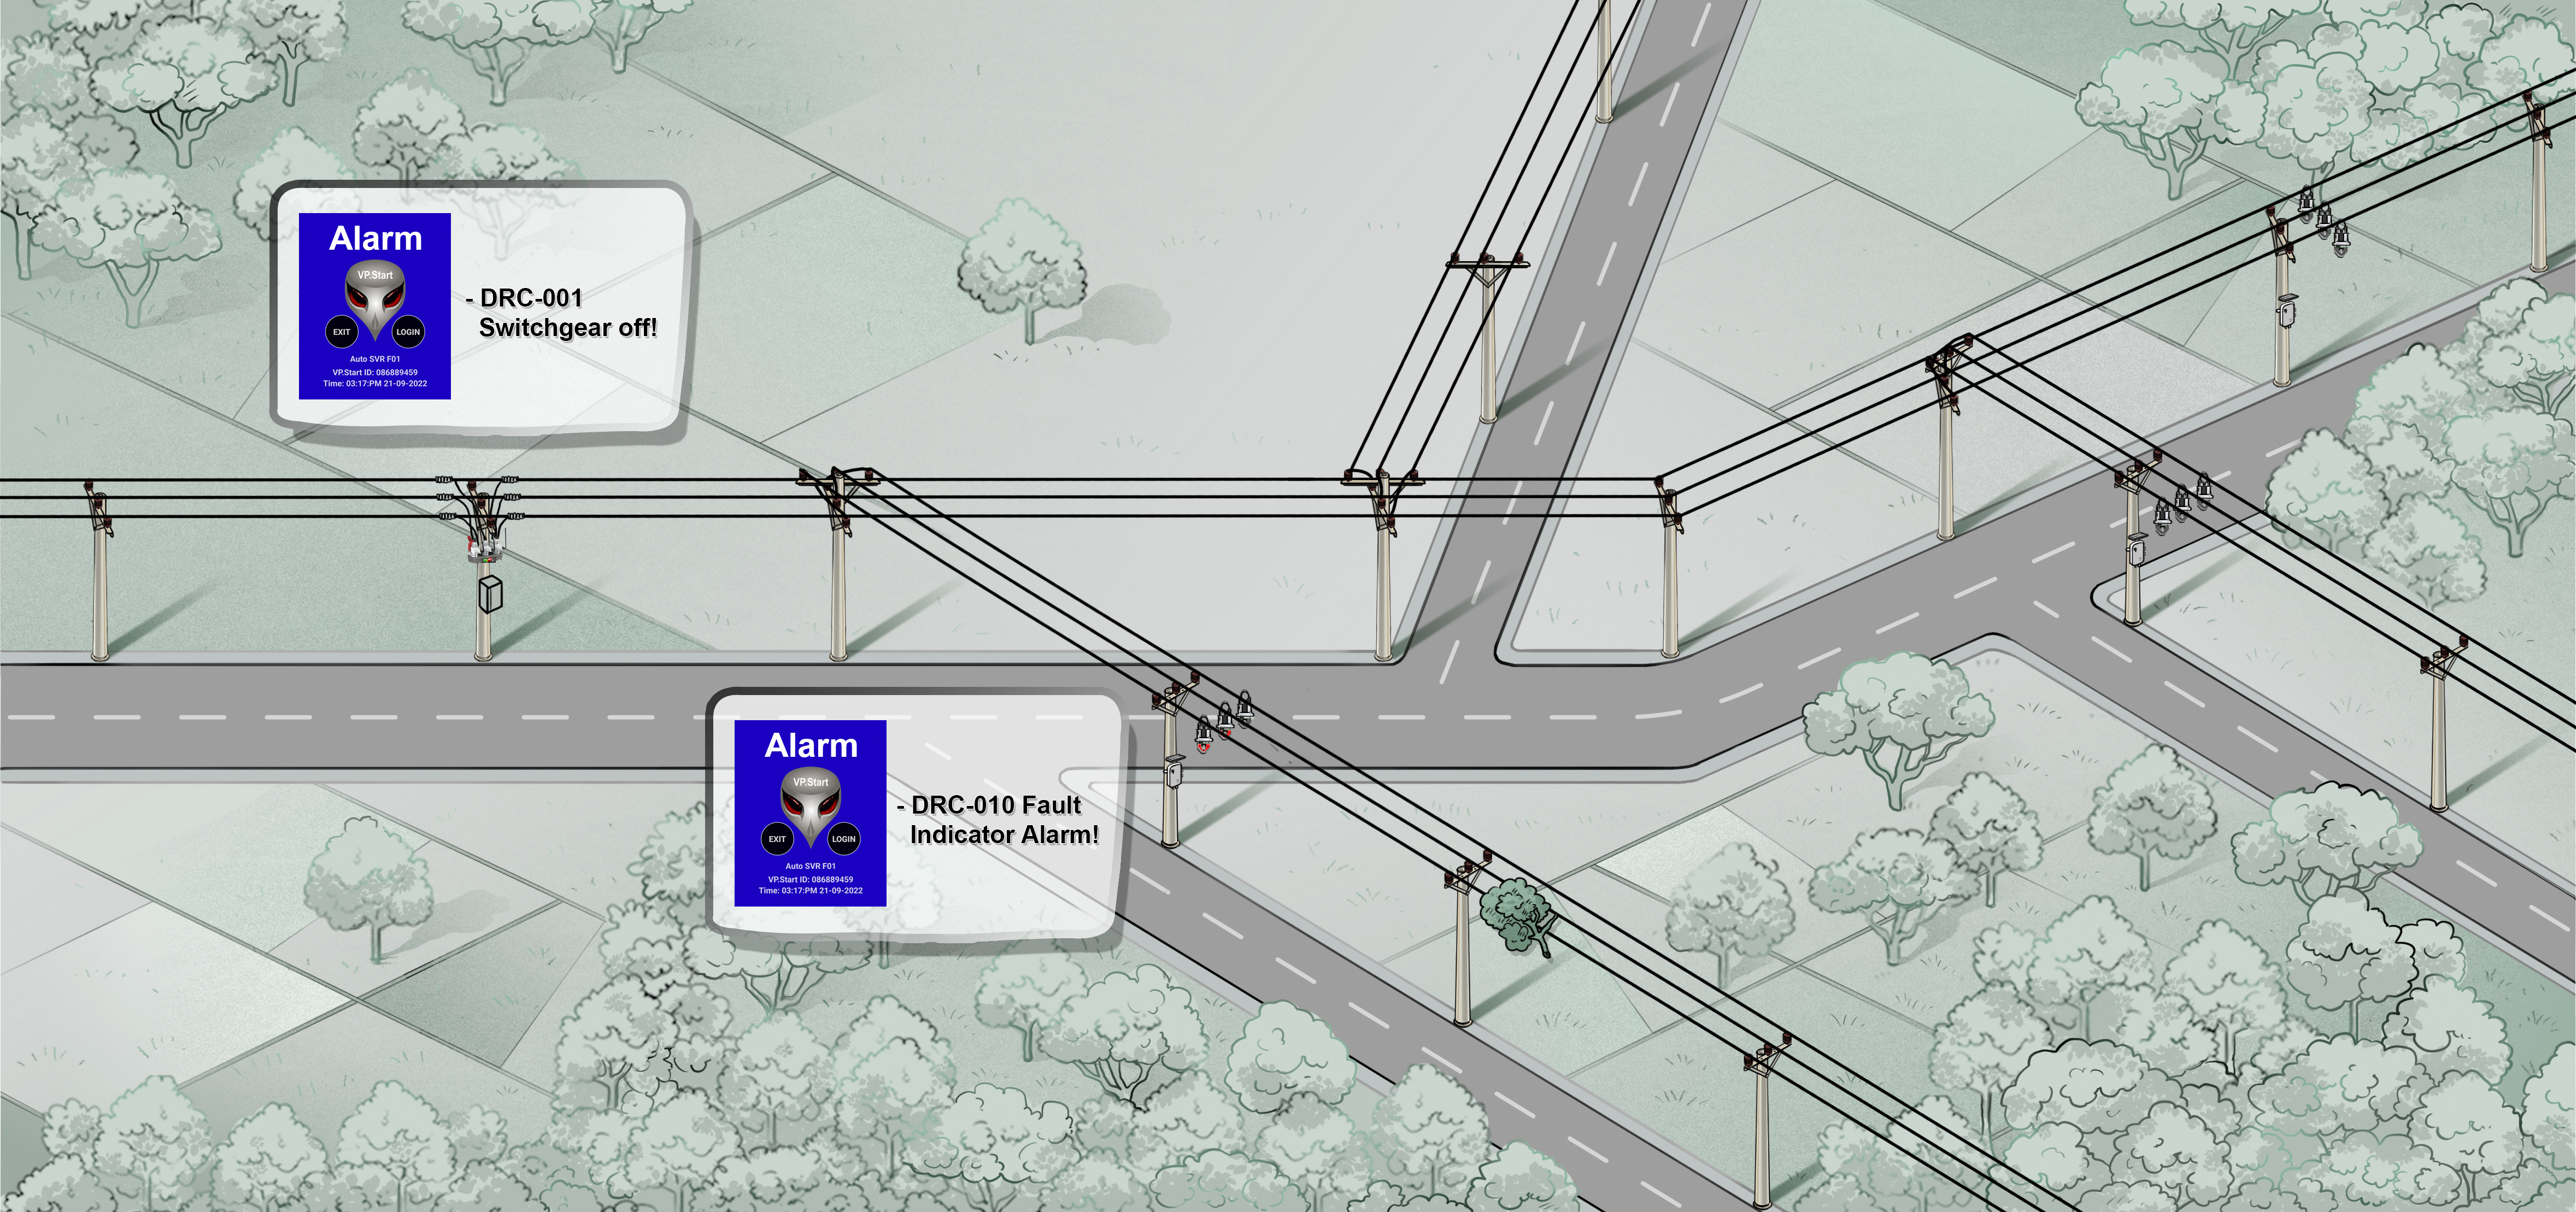
NO MEANS OF AUTOMATED FAULT DETECTION AND FAULT CLASSIFICATION
 The overwhelming majority of electric utilities operating throughout developing countries, specifically in the case of Cambodia have little to no insight on when a fault occurs and identifying the type of fault that has occurred. Although this isn’t the case as much as it was in the past, then grid-operators would be notified through a customer complaint call to their local electric utility provider, after which, it would be up to the operator to identify the location of the fault, it’s type and manage the restoration of power at any given time. In such a process, customers would suffer financial losses due to pro-longed outages lasting upto 4 - 5 hours [Click Here To See How We Solved This] because grid operators did not possess automated and data-driven capabilites to resolve fault detection and fault classification challenges on their distribution grids (Fault management systems).
NATURAL DISASTERS
“Force Majeure” events such as floods, earthquakes, typhoons and rain storms etc. often affect power grids. Even the ones considered to be resilient. The key challenge for operators facing natural disasters, as unavoidable as they may be, is how to achieve overall minimization of risks and damages to their grid infrastructure, assets and to human lives.
 With appropriate control systems, such as a smart-grid resource planning management software or equivalent digital management platforms (SCADA, ADMS, etc), this task can be as simple as proactively ensuring that the system is de-energized and re-energized at the right time and at the right place before and after natural disasters occur. Through a smart-grid control platform, operators are able to benefit from a combination of data-driven insights, forecasting and remote control capabilities to ensure they’re making the best decisions possible during natural disasters to achieve higher grid resilience and minimization of losses wherever possible.
As a result, resource planning management platforms as part of a suite of smart-grid technologies, enable operators to extend control to the “edge” of the whole system offering much flexibility. This, coupled with remotely controlled and monitored DERs (Distributed Energy Resources) such as renewables, micro-grids etc when needed the most are able to unlock higher thresholds of grid-reliability, sustainability and minimization of outages for power consumers and businesses. In other words, the end-users (Homes, businesses etc) of the grid are able to experience higher energy reliability and experience lesser outages and lesser power interruptions.
POWER SYSTEM RELIABILITY: SAIDI, SAIFI & CAIDI
In a power system consisting of either generation, transmission, distribution and/or consumption, the term “reliability” can have different meanings depending on the mathematical models used to calculate and define “reliability”.
Yet still, reliability remains an essential focal point as the power grid becomes further complex with the global increase in consumption of energy, addition of IoT technologies, renewables, transitioning of coal-fired power plants through hydrogen-powered gas turbines (Grid greenification) and battery technologies, electric vehicle charging stations, power-intensive crypto mining, the addition of DERs (Distributed energy resources) and other load-balancing requirements. Lastly, the added challenges brought on by climate change and cyber security pertaining to critical infrastructure are also looming on the horizon.
In sum, reliability ratings and scoring mechanisms remain critically important as the world becomes more data-driven, more energy-conscious and more energy reliant.
SO WHAT IS A RELIABLE POWER SYSTEM?
Simply, a reliable power system is one that is essentially available whenever it is needed most of the time. It is a power system where issues of service interruption (power interruption) or power loss are minimized or non-existent. In other words, it is a dependable system and performs as promised. The fulfillment or attainment of set reliability benchmarks equates to business and operational continuity for businesses and their end users.
In the context of power systems and electrical reliability, one may wonder, what defines or constitutes as being reliable “most of the time”. Is it 60%? 85% etc? In this case, system reliability, especially in the case of electrical distribution systems (Distribution grid) can be defined as the probability that a system i.e item, machinery, hardware, software etc all combined will perform their intended functions without experiencing failure for a specified period of time under pre-specified operating conditions.
In other words, this means that an electric utility company, which is responsible for the management and distribution of power in their allotted zone (Whether a city, part of a province, special economic zone etc) over a specified time period is “defaulting” on their promise of maintaining power supply stability at 90%-95% of the time. Hence, it can be found to be “unreliable” because, ideally, an electrical system that is reliable, is one that works without fail 100% of the time or is able to meet its promises to customers.
As authorities, put more pressure on utilities to perform and provide evidence of their ability and reliability to distribute electricity, similarly, consumers are expecting power supply stability without interruptions.
Thus, regulatory authorities and engineers alike are increasingly interested in how well electricity is provided to the end users. As such, engineers, authorities, and international organizations have developed international standards such as those developed by the IEEE (Institute of Electrical Electronics Engineers) to help with scoring or rating reliability within power distribution grids.
Although there are multiple scoring indexes used throughout the world to indicate the reliability of different countries’ energy systems, such as;
MTBF (Mean Time Between Failure)
MTBR (Mean Time Between Replacement)
MTTR (Mean Time To Repair)
CAIDI (Customer Average Interruption Duration Indices)
LOLP (Loss of Load Probability)
ENS (Energy Not Supplied)
AENS (Average Energy Not Supplied)
EENS (Expected Energy Not Supplied)
EFLC (Expected Frequency of Load Curtailment)
For the sake of simplicity, we will focus on three core indices of reliability that sum up well the reliability and performance of an overall power system;
SAIDI (System Average Interruption Duration Index)
SAIFI (System Average Interruption Frequency Index)
CAIDI (Customer Average Interruption Duration Index)
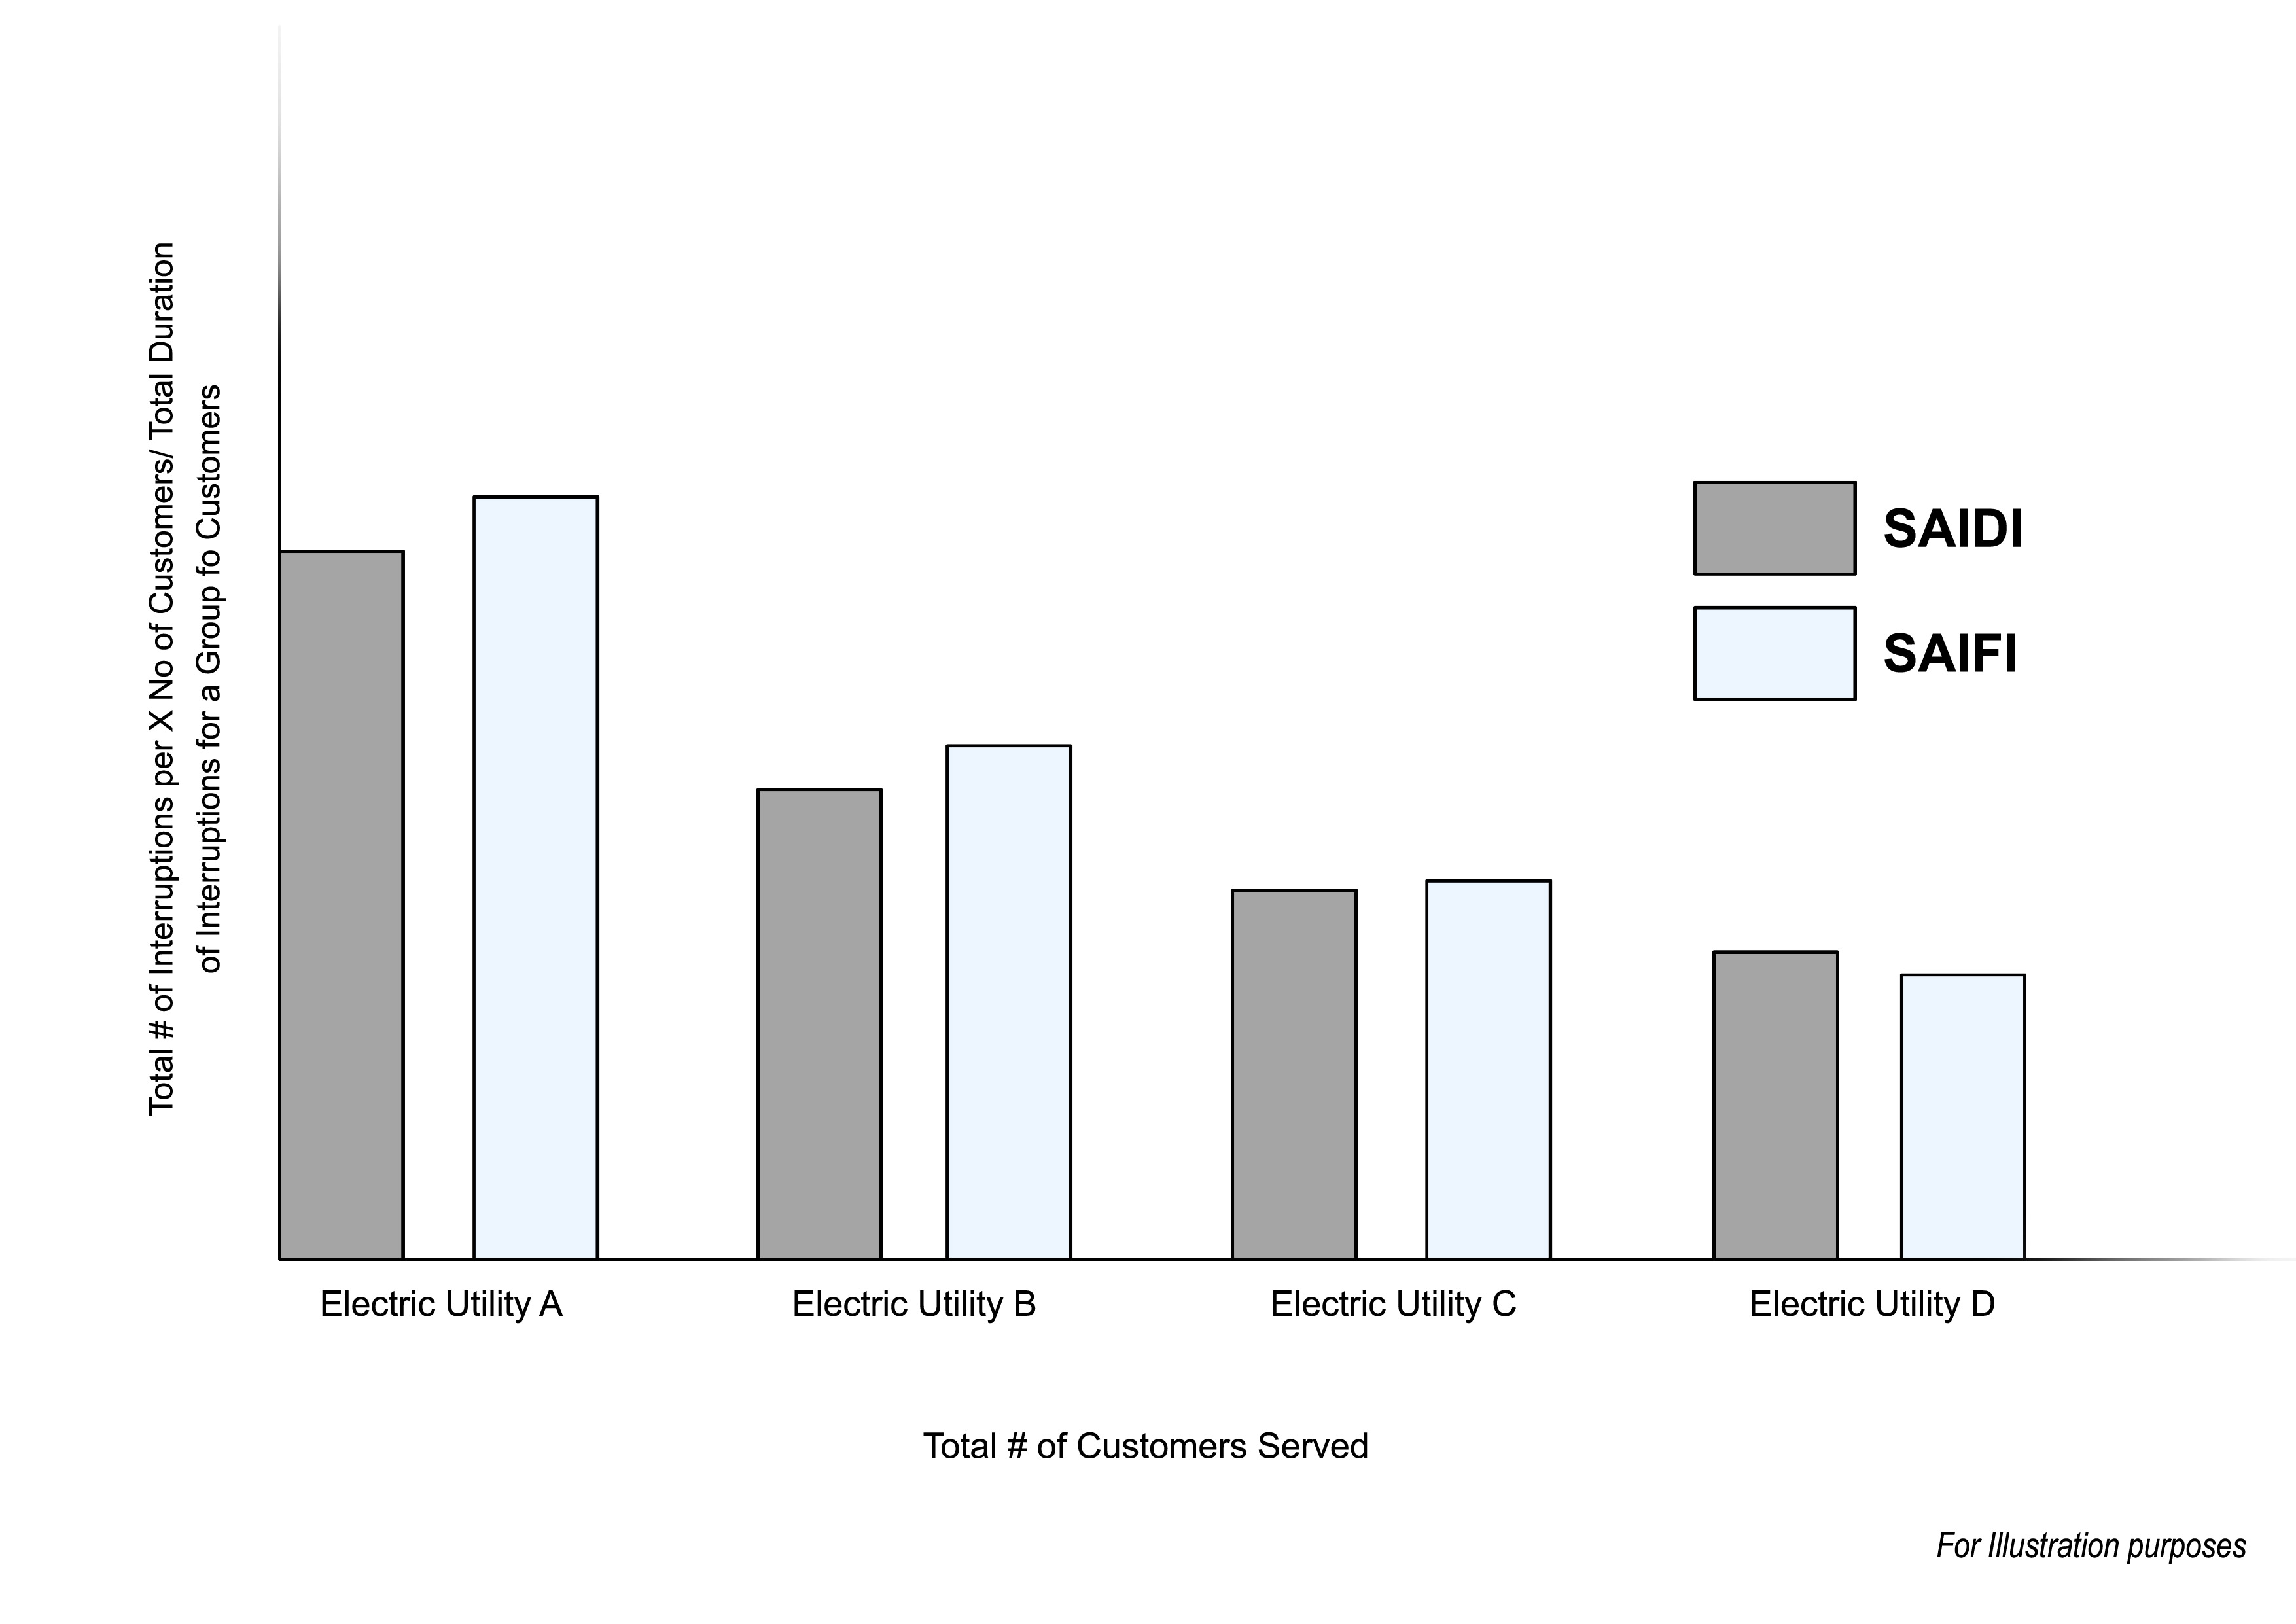
SAIDI (System Average Interruption Duration Index) is a system index of the average duration of interruption in power supply indicated in minutes per customer. Calculated by:
= Total duration of interruptions for a group of customers
Total number of all customers being served.
SAIFI (System Average Interruption Frequency Index) is a system index of the average frequency of interruptions in power supply. Calculated by:
= Total number of interruptions for a group of customers or total # of interrupted customers
Total number of all customers being served.
CAIDI (Customer Average Interruption Duration Index) is a system index of the average interruption duration faced by a customer in the power system. Calculated by:
= Total duration of interruptions in a year or specific timeline (Day, week, month, X etc)
Total number of interruptions for a group of customers or total # of interrupted customers
Or = SAIDI
SAIFI
In FIGURE X. Below, we can see an example of a table a utility operator can refer to with specific data points
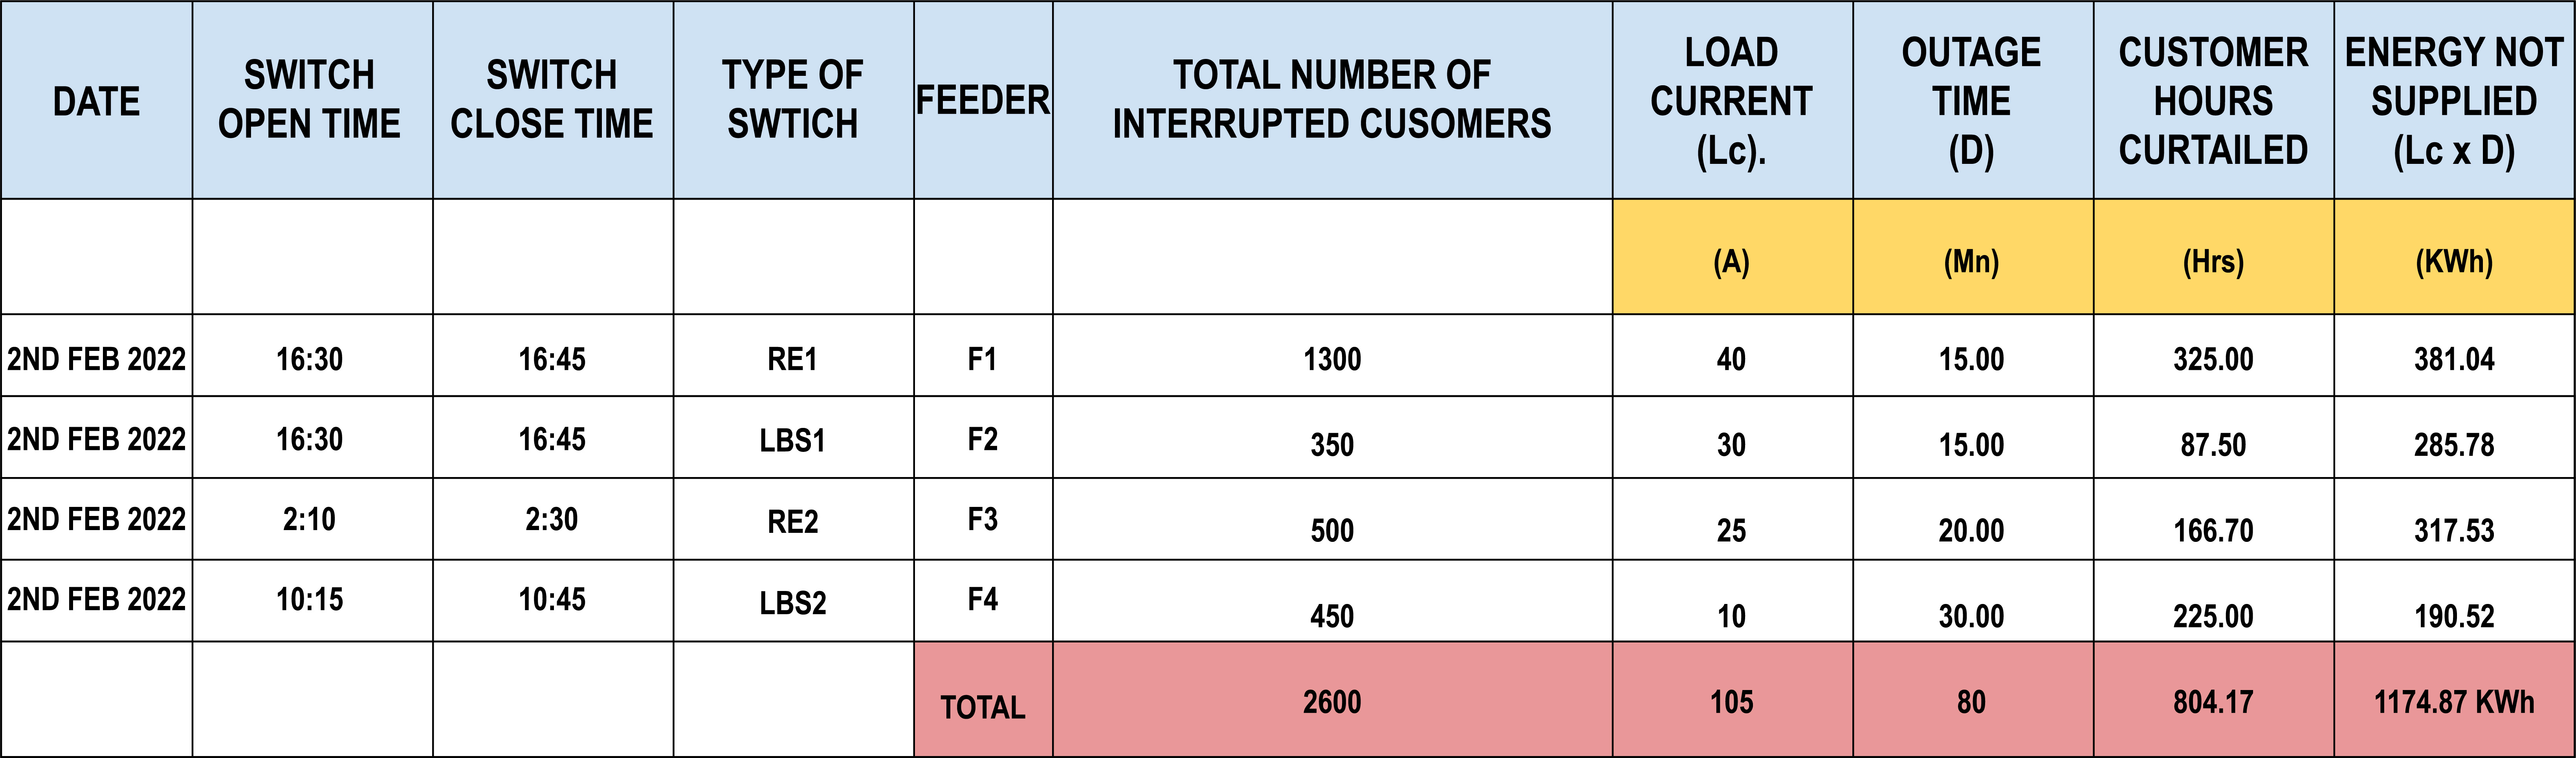
By using a SCADA system or power system monitoring software, data collected can be manually recorded and analyzed where automated or high-software is not available to conduct calculations on scoring grid reliability. Retrieving SAIDI, SAIFI and CAIDI indices are most common, simple, and useful to a grid operator’s understanding.
In Figure X. Reliability is being calculated for each Feeder line (F1, F2, F3 and F4) with the combination of total number of interrupted customers, the load current levels (A), outage time (D) in Mn (Minutes) etc to calculate number of customer hours curtailed (NC X D).
Let’s assume that the electric utility provider in figure X., has a total of 10,000 customers throughout their zone.
TO CALCULATE SAIDI
For all feeders (F1, F2, F3 and F4), we may refer to the column; “Total number of customer hours curtailed “. The total amounting to 804.17 Hrs of customer curtailment due to an outage or simply; Total hours for a group of grid-connected customers where energy was not supplied.
In order to calculate SAIDI in minutes for all customers connected to the power system, this figure must be converted into minutes = 48, 250.2 minutes (804.17 Hrs X 60 minutes).
Hence SAIDI will be:
= 48, 250.2 Minutes (Total duration of interruptions for a group of customers)
10,000 Customers (Total number of all customers)
= 4.825 Minutes per customer (SAIDI score)
TO CALCULATE SAIFI
For all feeders (F1, F2, F3 and F4), we may refer to the column; “Total number of interrupted customers”, equalling 2600 customers on the day of 2nd Feb 2022.
Hence, SAIFI will be:
= 2600 (Total number of customers interrupted)
10,000 (Total number of all customers being served.)
= 0.26 interruptions per customer at the utility. (SAIFI Score)
For comparison's sake, as SAIFI is usually measured over the course of a year, according to IEEE standards 1366-1998, the median SAIFI value for North American utilities is 1.10 interruptions per customer per year.
In our calculations, we find that on the day of 2nd Feb, 2022, a customer will face 0.26 interruptions in a day. It is up to the utility to benchmark what duration of the outage, whether 5s secs or more or in some cases only outages 5 minutes or more would be included in SAIFI calculations.
TO CALCULATE CAIDI
For all feeders (F1, F2, F3 and F4), we may refer to the column;
= X (mins) total duration of interruptions in a year or specific timeline (Day, week, month, X etc)
Total number of interruptions for a group of customers or total # of interrupted customers
= 48, 250.2 Minutes (Total duration of interruptions)
2,600 (Total number of interruptions for a group of customers or customers interrupted)
= 18.55 minutes on average per outage per customer on 2nd Feb 2022. (CAIDI Score)
Similarly, this can also be used to find SAIFI as mentioned above in the formulas & verify calculations;
= SAIDI = 4.825 Minutes per customer = 0.26 interruptions per customer (SAIFI).
CAIDI 18.55 Minutes per customer
In sum, the electric utility provider in figure X, with a total customer base of 10,000 in their distribution network on the 2nd of February 2022, had the following reliability scores:
SAIDI = 4.825 minutes per customer.
SAIFI = 0.26 interruptions per customer.
CAIDI = 18.55 minutes on average per outage per customer.
Hence, its straightforward to see why SAIDI, SAIFI and CAIDI are the basis for most popularly used indices when it comes to understanding reliability of a power system and is a great starting point before further data-collection, analysis and decision making needs to be done. Whether its for maintenance purposes, for example, investing in additional electrical equipment like circuit-breakers, meters, fuses and reclosers etc that need to be comissioned to reduce outages and increase reliability, the data and numbers justify any decision going forward for efficiently operating an electric utility.
5 BASIC SOLUTIONS FOR MANAGING POWER-GRID STABILITY
Depending on the nature of the problem in the power system, technical complexity, urgency and gaps within an operator’s situational awareness scope. There are a number of basic options and remedies an operator might have at their disposal whether or not they have deployed advanced distribution management systems.
In Cambodia, a majority of private and public electric utilities tend to find the following remedies to be effective:
ASSIGN KEY MEMBERS OR TEAMS FOR TRAINING ON MAINTENANCE, INSTALLATION & ANALYSIS
Electric utilities in certain countries, mostly within mature or developed power markets, are commonly mandated by strict and clear laws to conduct routine maintenance. As such, the need for having dedicated teams or personnel at all times to maintain power-grid and other critical public infrastructure is necessary. In certain developing countries where such policies are in development, there are still chances for mishaps and lapses that can lead to bigger problems within power systems. Especially where regulatory enforcement mechanisms are still lacking and/or maturing. 
To plan effectively and ensure higher levels of reliability, assigning members and teams to conduct maintenance, installation and analysis work goes without saying. What is more important is to start with awareness building that comes after investing in training.
Basic training would go a long way in not only saving lives but also covering basic but key topics such as understanding the functions of power-line components such as surge arresters, and polymer string insulators and having teams look out for visual signs of any burn marks. Similarly, introductory training should also cover the basic operation of key distribution grid equipment such as load-break switches, auto-reclosers and frameworks for being able to assess the life-cycle stage of grid assets either through inspection or testing during maintenance routines. In tandem, these topics would also cover subjects such as assessing sufficient clearance of obstructions on overhead lines from trees and other buildings, thereby resulting in increased knowledge and improved skill sets of teams when they go on to conduct their own assessments of power-flow.
IDENTIFY POINTS OF VOLTAGE FLUCTUATIONS (OVERLOAD & UNDERLOAD) WITHIN THE POWER-SYSTEM
Voltage fluctuations, sometimes referred to as overload and under-load events (load-losses) etc can cause serious complications with power flows and the overall power system. If left unresolved, these issues result in low-quality power which goes on to cause financial losses for both the end-consumer and electric utility responsible for distributing power. 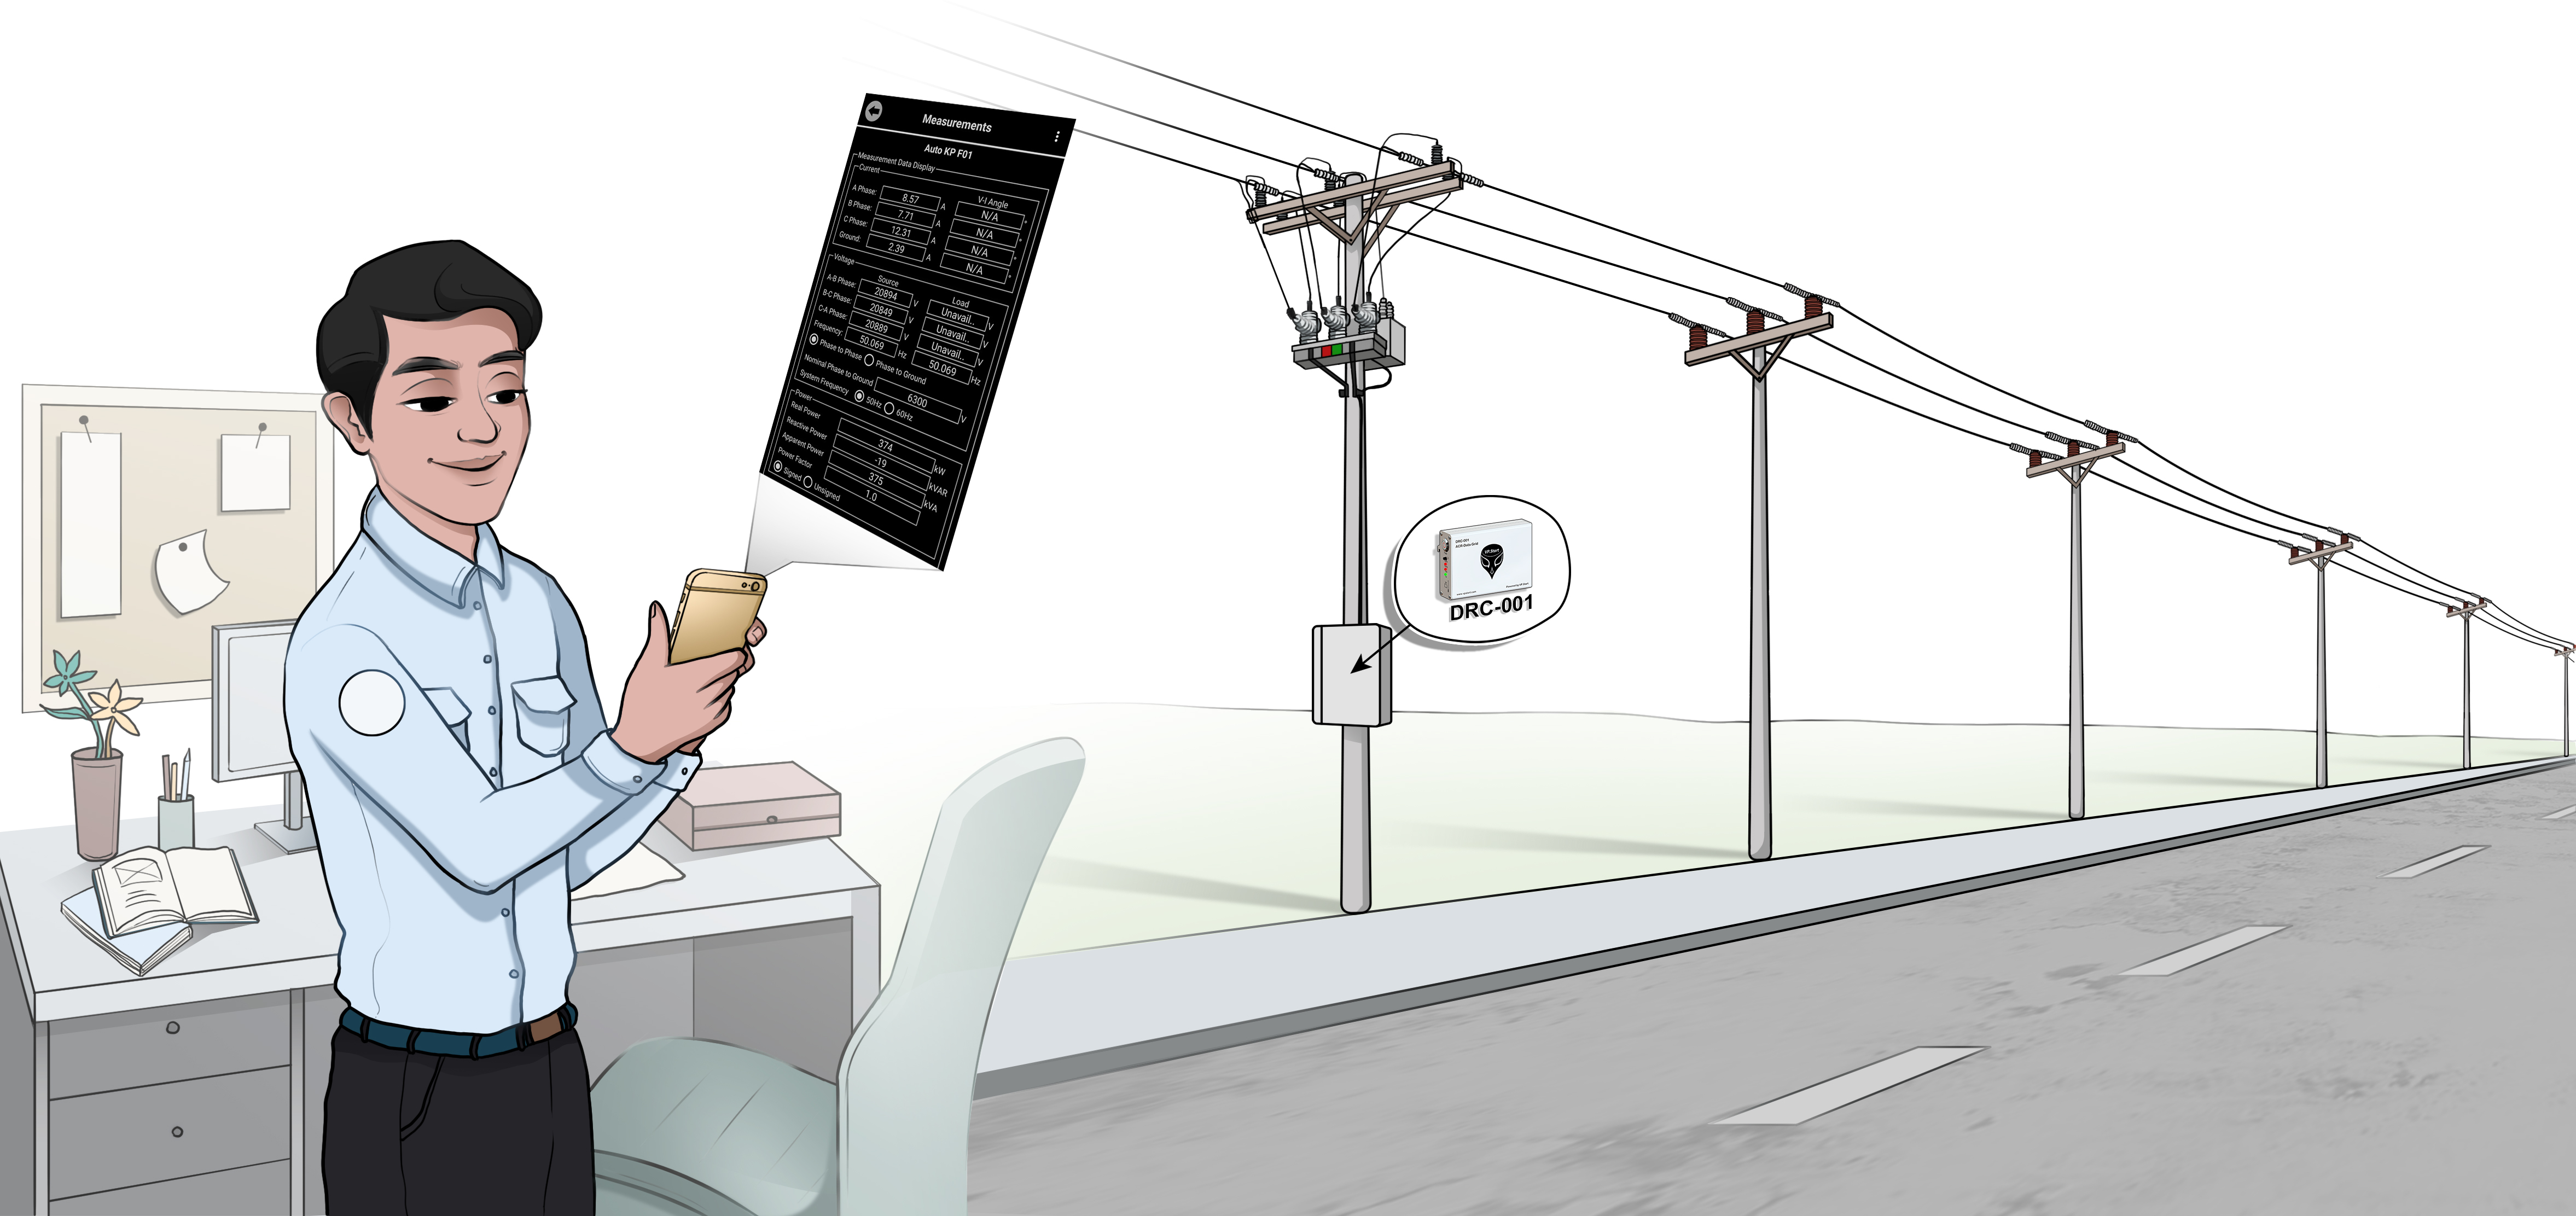
To identify such points within the system, teams and personnel can for example; Inspect the event logs of auto-reclosers and meters whilst focusing on readings for peak loads on daily, weekly and monthly timelines. Such inspection would also give them an opportunity to assess the efficiency or operation of already commissioned equipment along distribution lines such as transformers, low-voltage cables, current-transformers etc which all play a crtifcal role in efficiently distributing power to the end consumer.
By looking back at the event logs either manually or automatically through ADMS (Advanced distribution management system) or SCADA (Supervisory control and data-acquisition) systems for trends in high-peak load or low-peak load periods, the utility would be capable of painting a picture of efficiency in power distribution and potentially eliminate left-over risks of blackouts. If high-peak power loads are breached repeatedly and for long periods of time, such findings would become the basis for justifying decisions such as investing in the construction of new distribution lines and electrical equipment to meet load requirements. We commonly find in our conversations with electric utilities in Cambodia that although high-peak loads or off-peak loads do occur, however, if this occurs for short amounts of time such as an hour throughout a 24 hour period, this is negligible and can be ignored - Given it does not worsen nor does the duration of such an event exceeds previous thresholds. 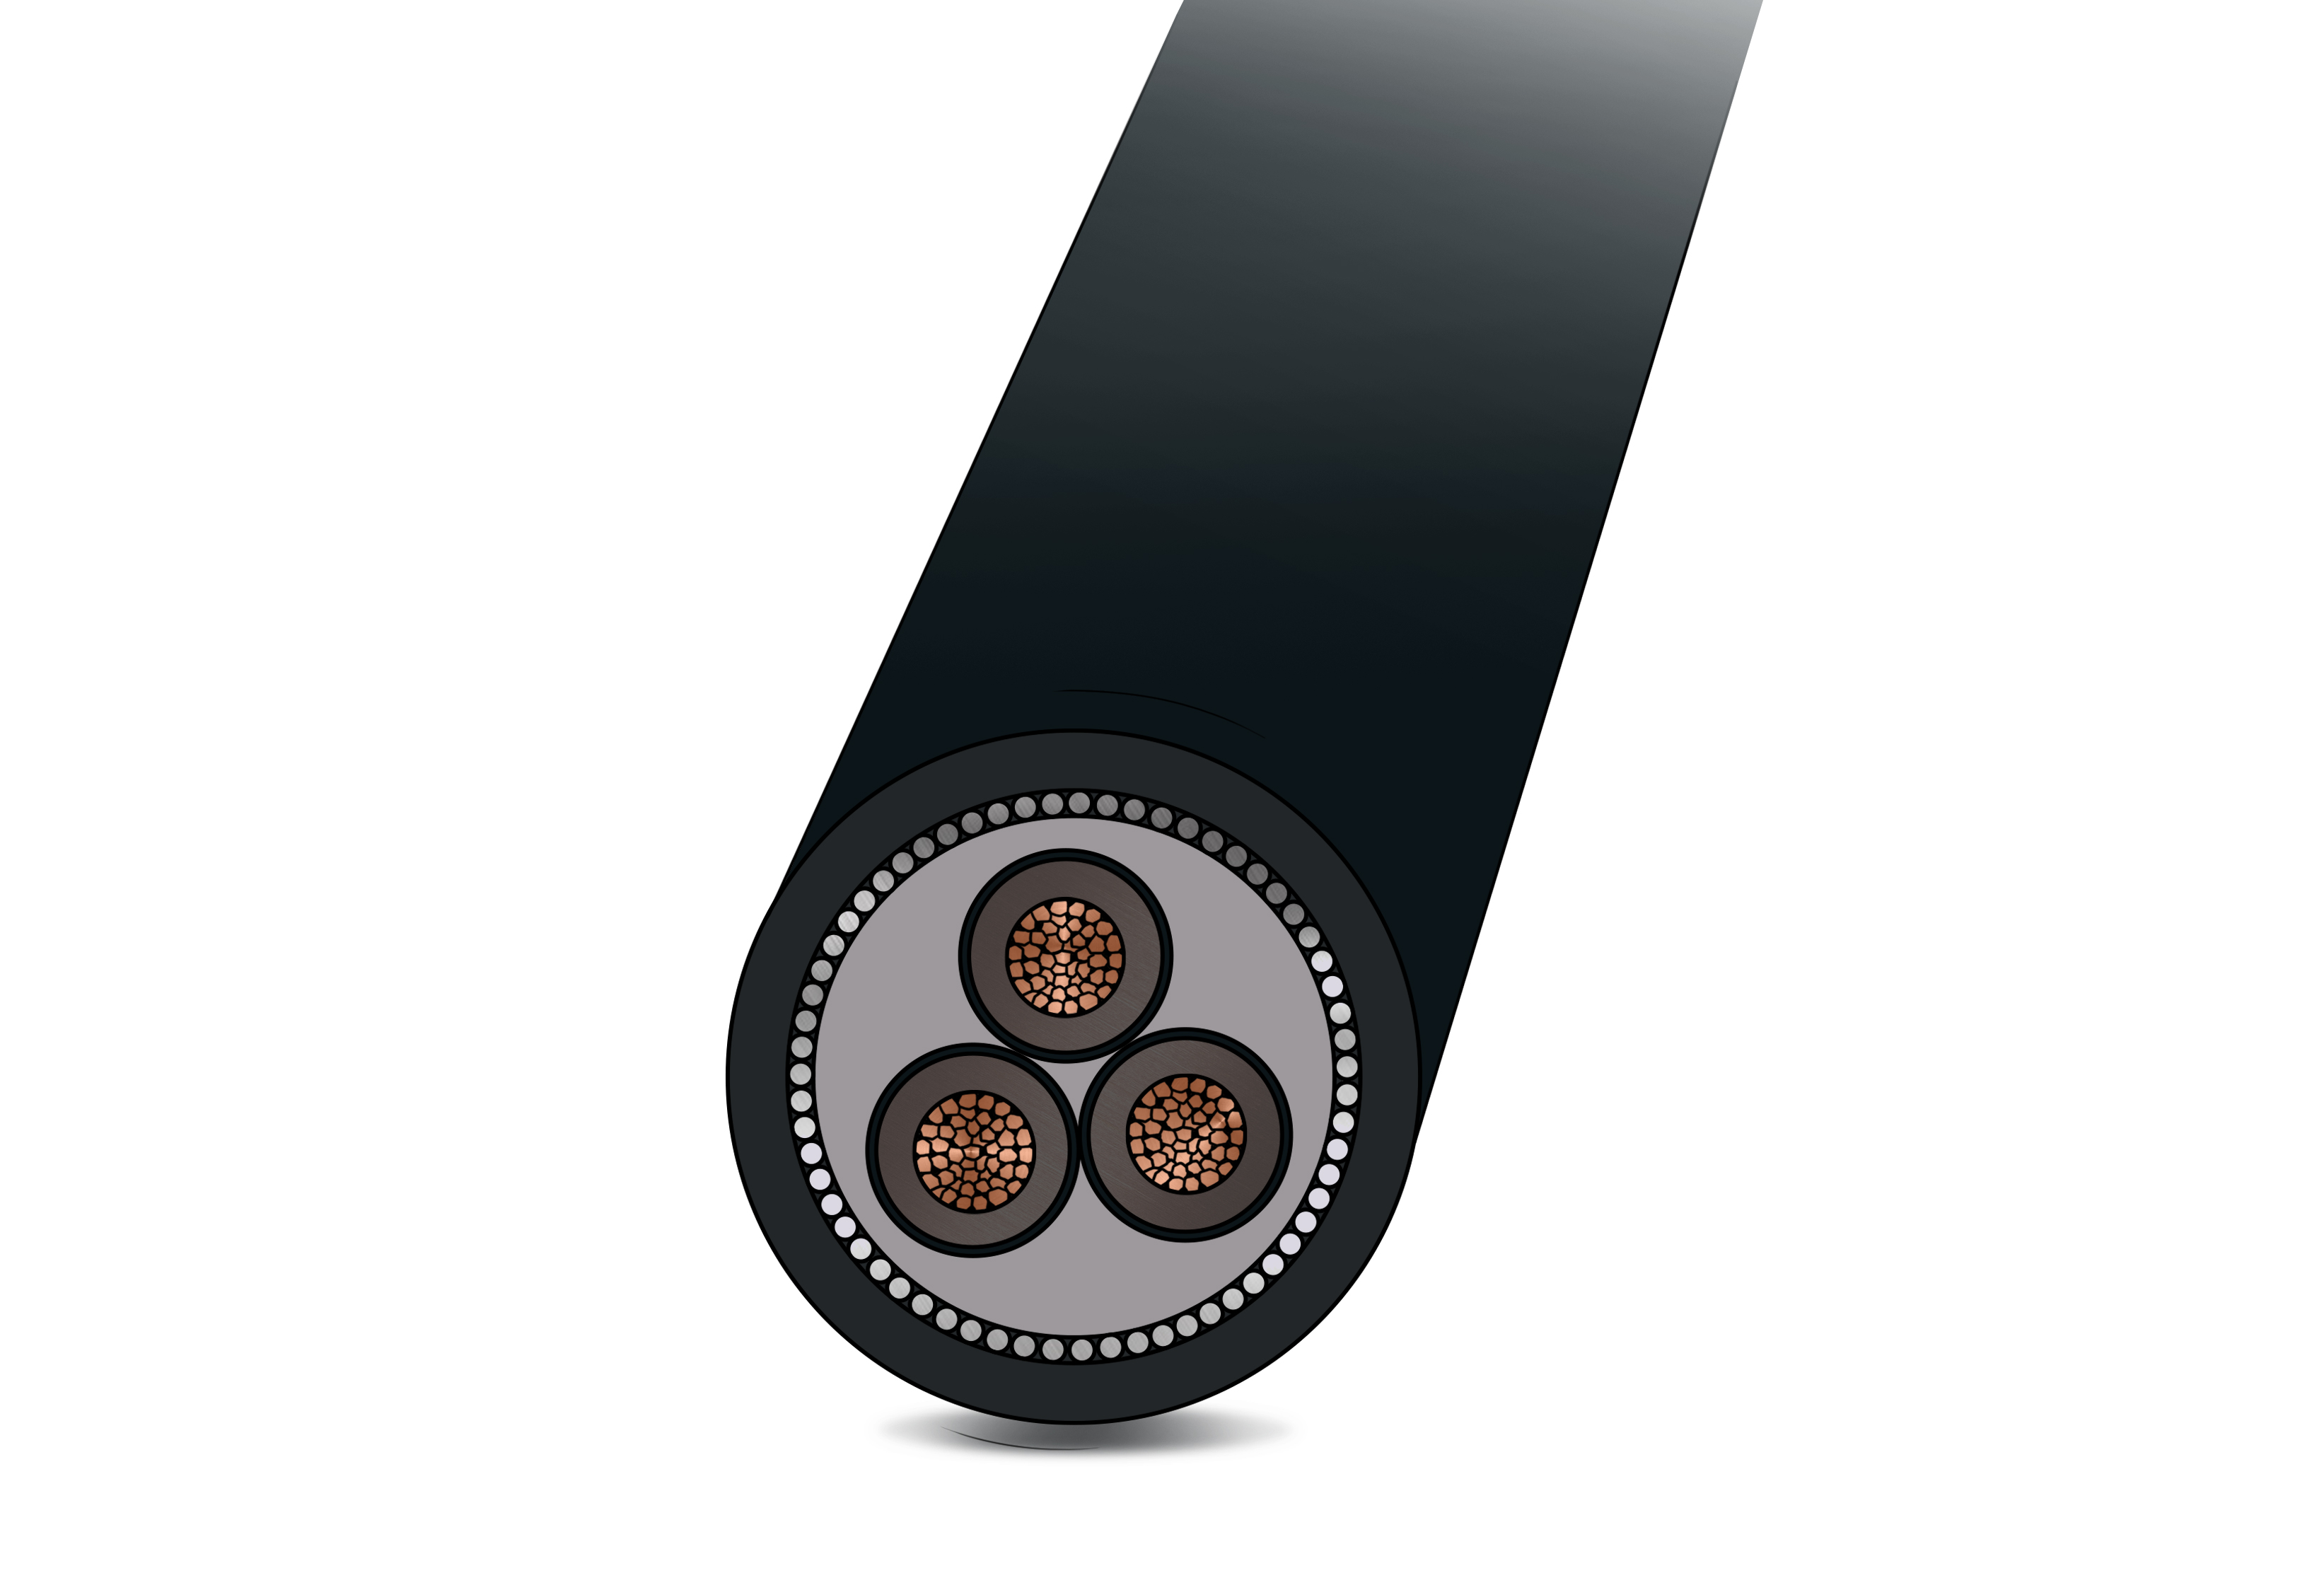
Lastly, causation of voltage fluctuations are not limited to just a fixed set of variables. As previously mentioned, in developing countries, the enforcement of IEC (International Electrotechnical Commission) standards are seldom followed and enforced. If for example, cable specifications for copper or aluminum wires that distribute electrical power are not appropriate, this too can lead to under and over-voltage fluctuations. The reasons for this are clearly stated by IEC standards 60228 & IEC 61089. Known as standards for “conductors of insulated cables”, the nominal cross-section of 22kV aluminum cables with a rating of 165 (A) (Ampers) need to be 35mm². If such standards are not adhered to and enforced by electric utilities, such issues can cause life-threatening over-voltage fluctuations and disturb the efficient distribution of electrical power to medium-voltage or low-voltage consumers.
CONSIDER LOAD SHARING BY A CLOSED LOOP CIRCUIT OR INVESTING IN A NEW POWER LINE.
As we focus and continue on the issue of peak-power loads, a basic solution is to consider load sharing with another power line through a “closed loop”. This would be especially helpful in meeting the power needs of energy-intensive consumers such as steel factories or heavy machinery plants.
Throughout our consultations with public and private electric utilities (Licencees) in Cambodia, electric utilities can consider investing in the construction of another additional or adjacent overhead power distribution line to load-share and balance the overall loads on the power system. Consider two diagrams below that illustrate the overloaded line and consequently load sharing in the second “before” and “after” single-line diagrams.
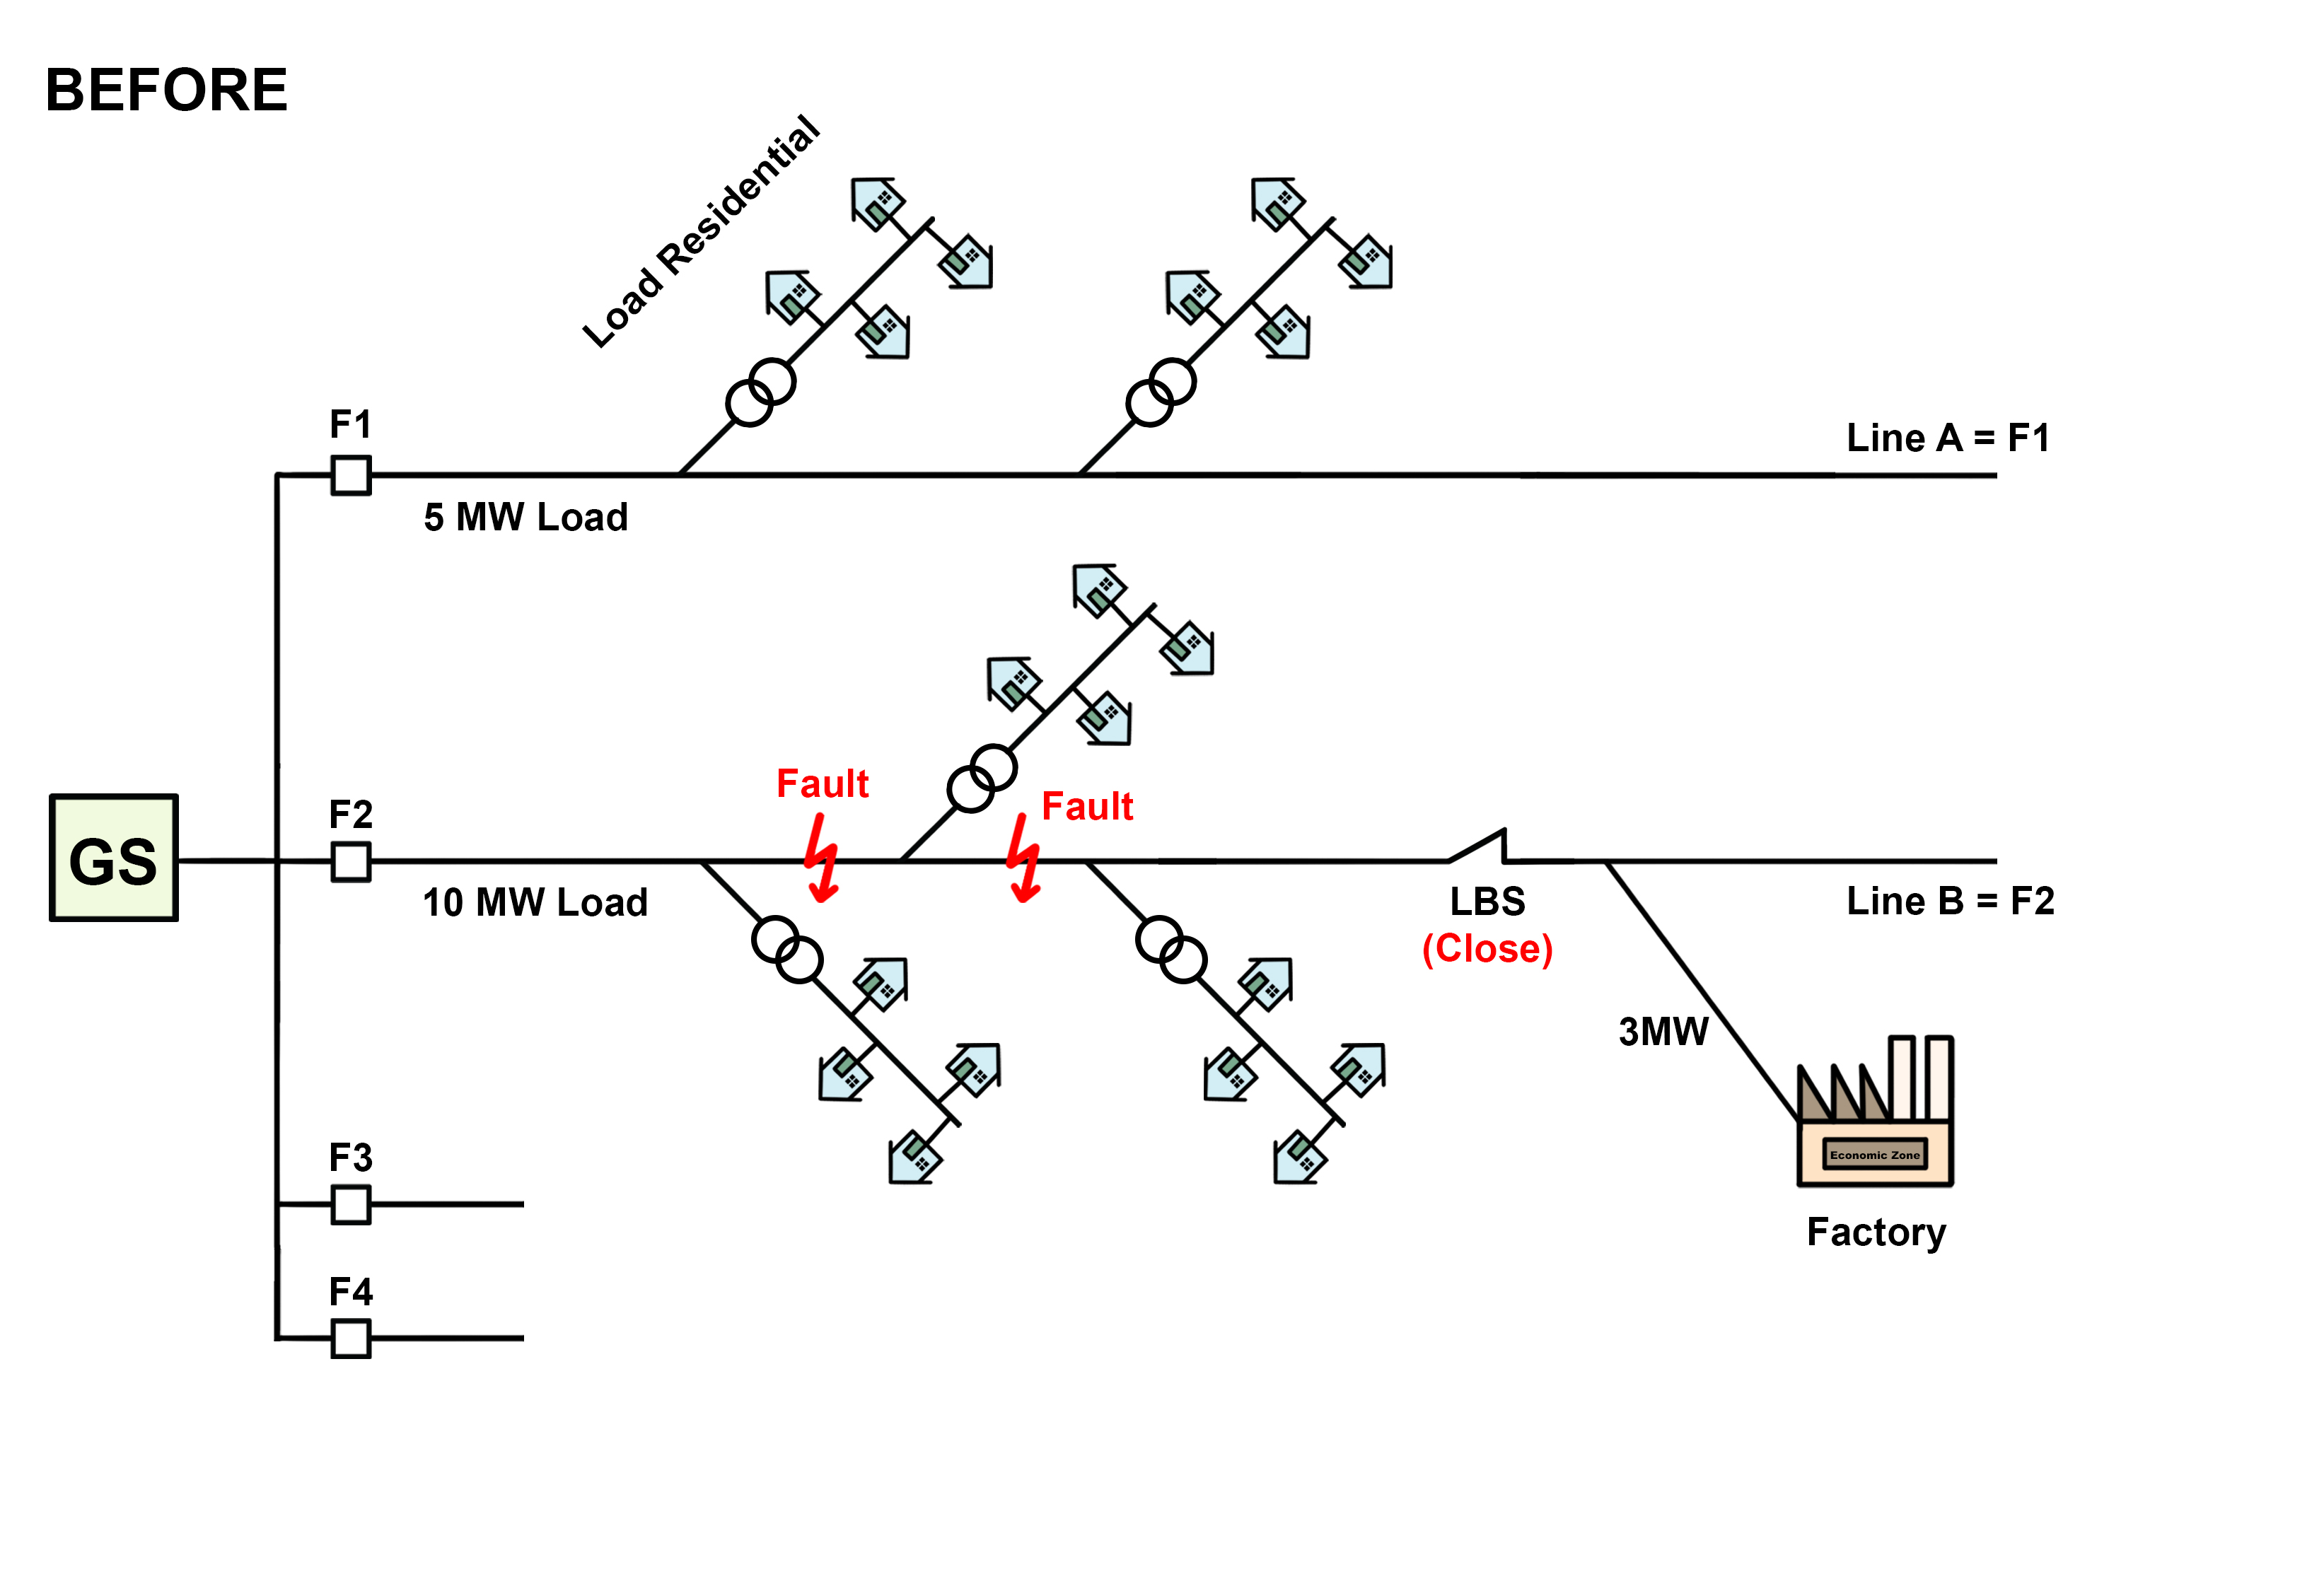 In the first image we can see that after power is distributed via feeder lines (F1, F2, F3 & F4) into medium voltage from a grid substation (GS), keeping focused on feeder 1 (F1) & feeder 2 (F2) - We see that there are two significantly varying loads; Feeder 1 with 5 MW (Megawatts) of load and feeder 2 with 10 MW (Megawatts) of load. As both lines are servicing residential area consumers, feeder 2 (F2), also known as line B, is further strained by a large factory that is consuming 3 MW (Megawatts) of electricity to operate.
Preceding the factory’s grid connection is also a medium voltage load-break switch (LBS) which is a type of electrical device that opens an electrical circuit to isolate power source (In this case, the grid substation) from the load which is the factory. We can also see that initial scenario is also causing multiple faults along the strained feeder line 2 (Line B) affecting residential consumers. In sum, line A (Feeder 1) and line B (Feeder 2) are unevenly balanced after power flows downstream from the grid substation.
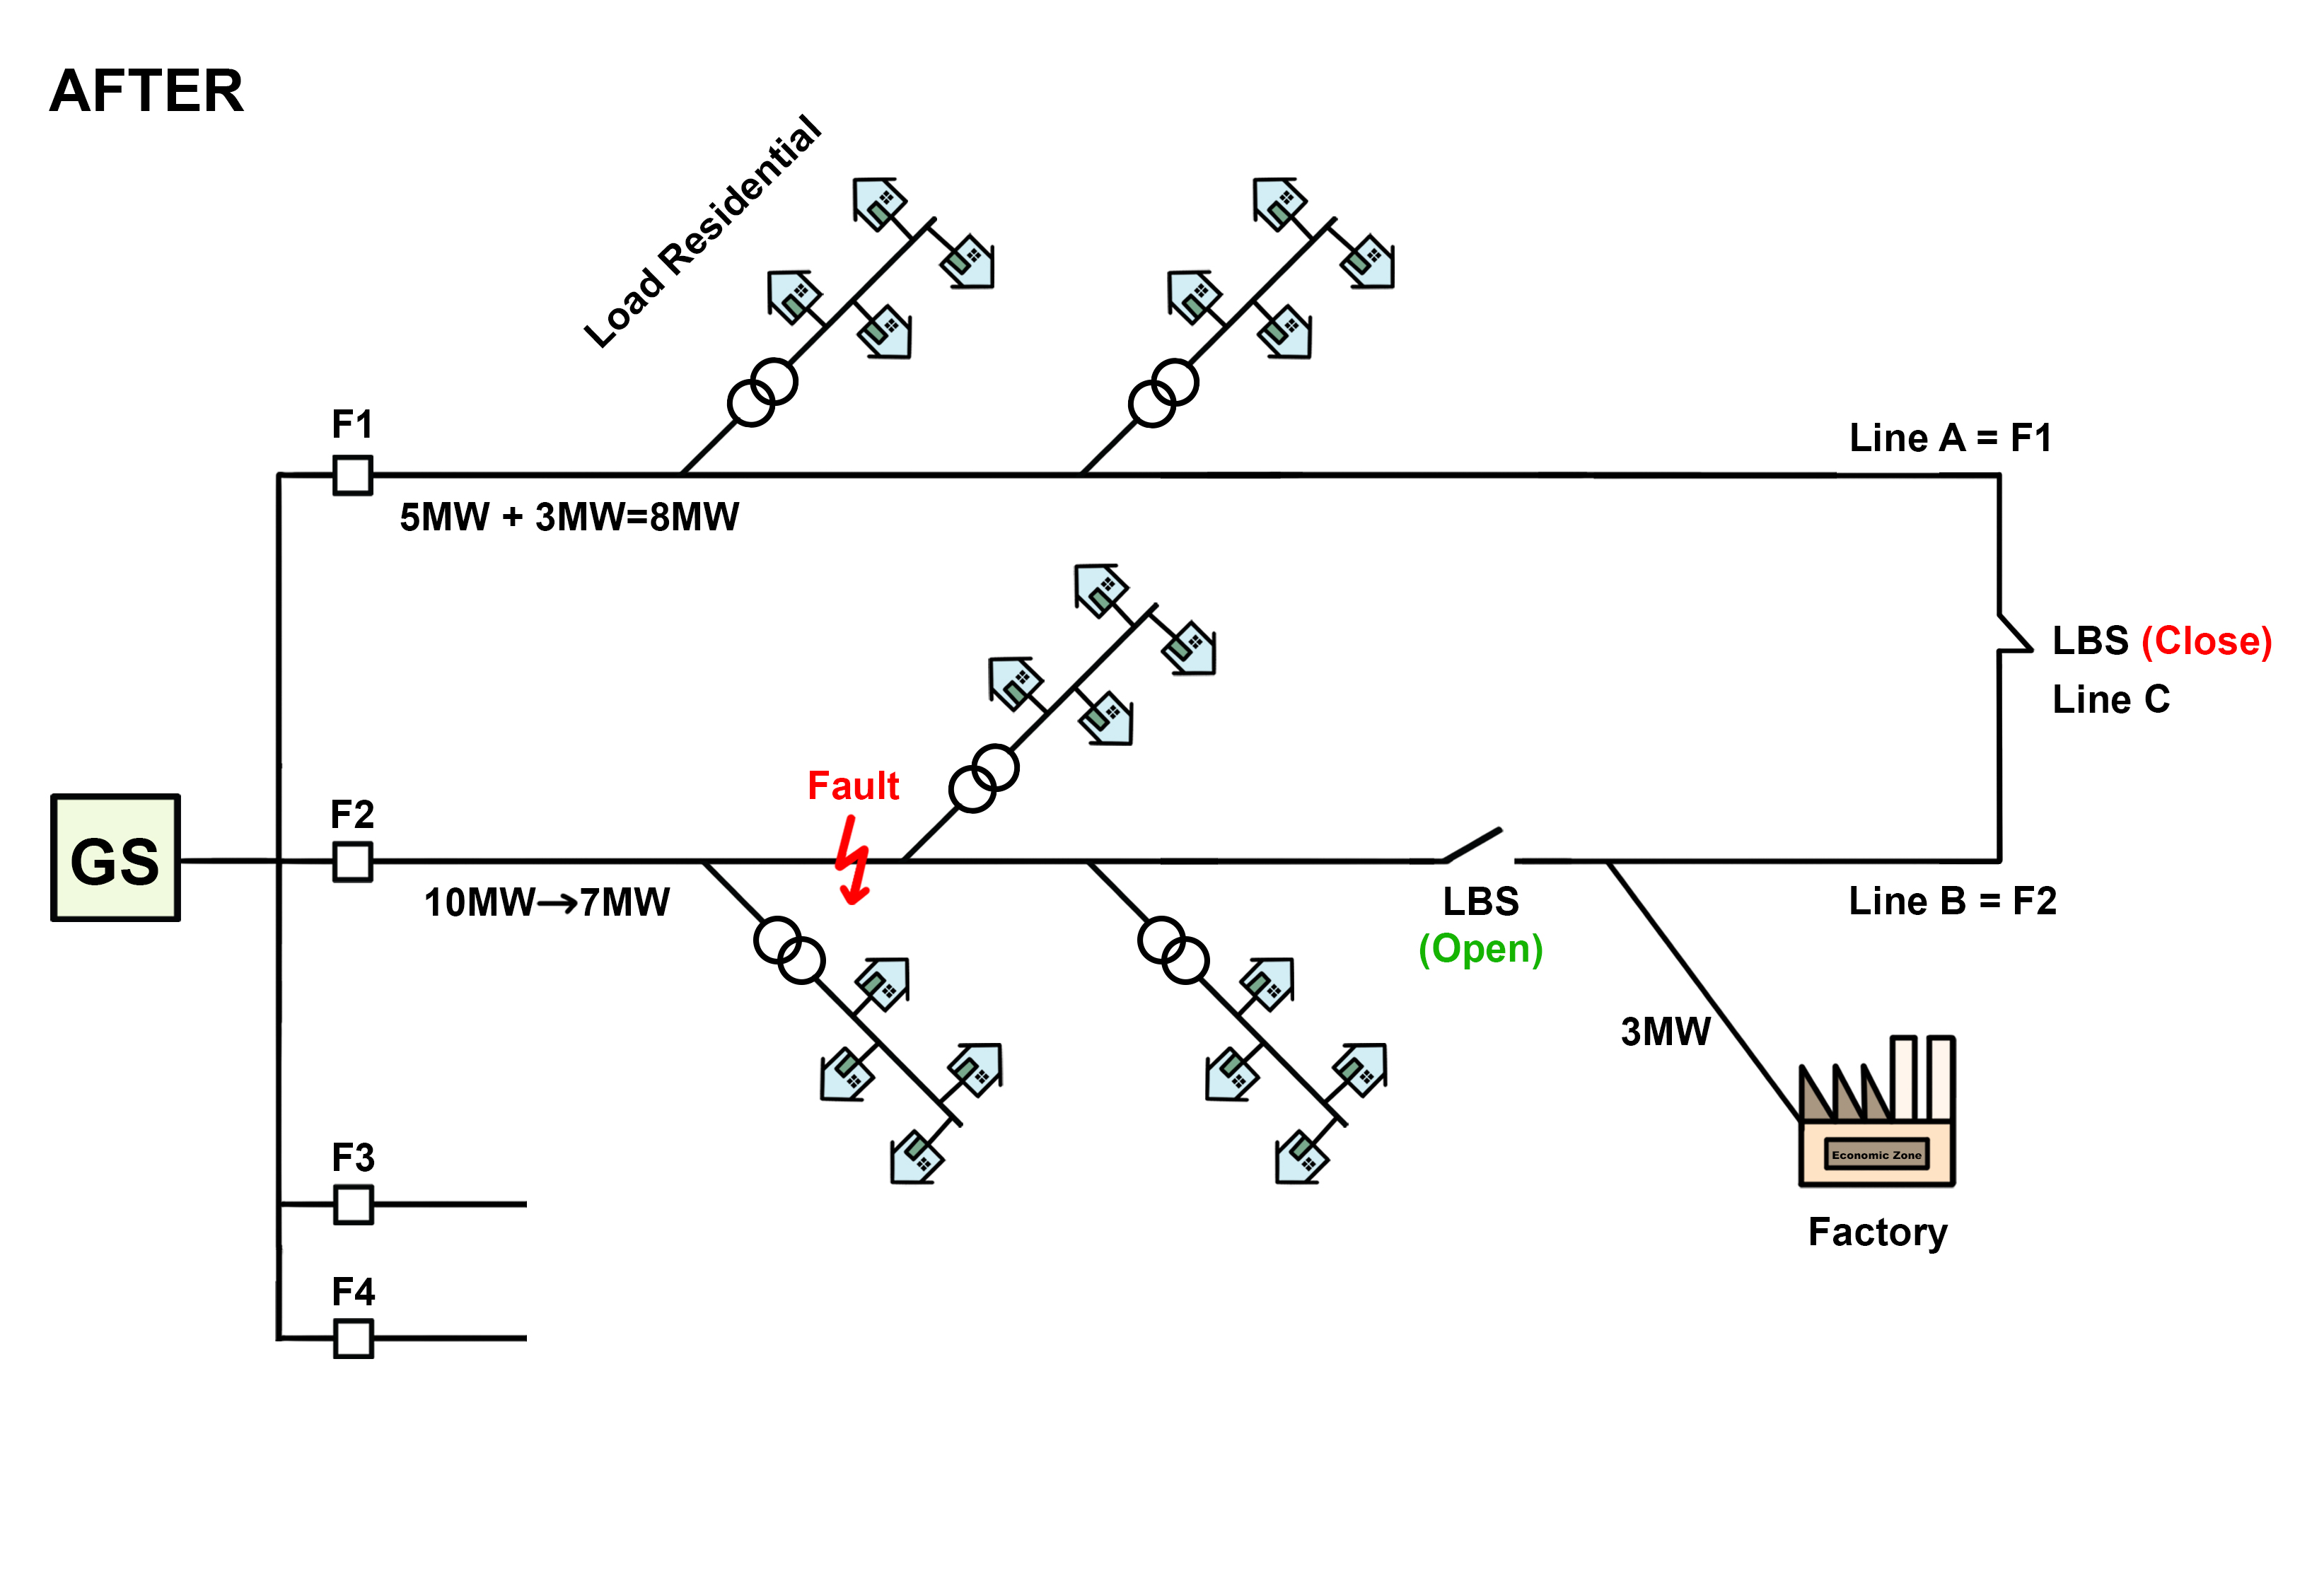
The solution as shown in the “After” image indicates that electric utilities may consider to invest in the construction of an additional line, in this case line C to achieve a “closed loop” and support it by installing an additional medium-voltage load-break switch. What this means is that when faults occur on line B (F2), the load-break switch (LBS) on line B (F2) would open, isolating the 3 MW (Megawatt) load from the factory while the load-break switch (LBS) on the newly constructed line C would simultaneously close and divert power from feeder 1 (F1) to line B until where its grid-connection to the factory. As a result, balancing both lines through the closed loop and efficiently meeting the power needs of the factory and residential consumers. Now, line A would be servicing 8 MW (Megawatts) of power requirements and Line B would be servicing 7 MW (Megawatts) of power requirements. Therefore, faults are eliminated or reduced, energy is more efficiently distributed, reliability has increased and both lines are well balanced. This high-level concept has been executed in rapidly developing and electrifying markets such as Cambodia.
Lastly, after the additional line has been constructed and if the grid expands with newer connections, of course, the electric utility operator might also install additional equipment like meters, fuse-savers, auto-reclosers etc as they see fit. These additional investments in grid stability would allow the operator to collect more data from points along the newly constructed power distribution line to increase their monitoring and control over power efficiency in the distribution grid.
IDENTIFY & RECORD WHICH FEEDER LINE HAS CONSTANT FAULTS
As energy technologies evolve in tandem with global advancements in hardware and software, data is undeniably, the focal point for all monitoring and controlling functions, especially for the effective management of power systems at electric utilities. In order for operators to increase their scenario awareness, data collection is absolutely essential. Otherwise, electric utilities risk both power and financial losses.
In terms of power-loss monitoring, to avoid short-circuits and other complications with power flow, a basic method of monitoring can be carried out by inspecting how often an auto-recloser is tripping, and which day or timeframe it is happening repeatedly. By doing so, it would also point out to the maintenance teams the phase on which the auto-recloser is tripping; whether 2 phase or 3 phase which is highly valuable information to remedy power-flow issues and better efficiency in power distribution for electric utilities.
For instance, if an auto-recloser is tripping repeatedly, this can mean a number of things as the usual lockout limit is 4 trip sequences. If the auto-recloser has tripped 4 times, it will lock out owing to the following possible reasons; tree-interfering with cable conduction, a broken cable, insufficient insulation lining, die-electric failures, or in certain cases, this could also be due to a “flash-over” event which coud be fatal to human life and damaging to grid assets. In this case, such findings would be highly beneficial and remedies such as justifying the installation of a SWER (Single wire earth return line) for distribution networks could also be undertaken.
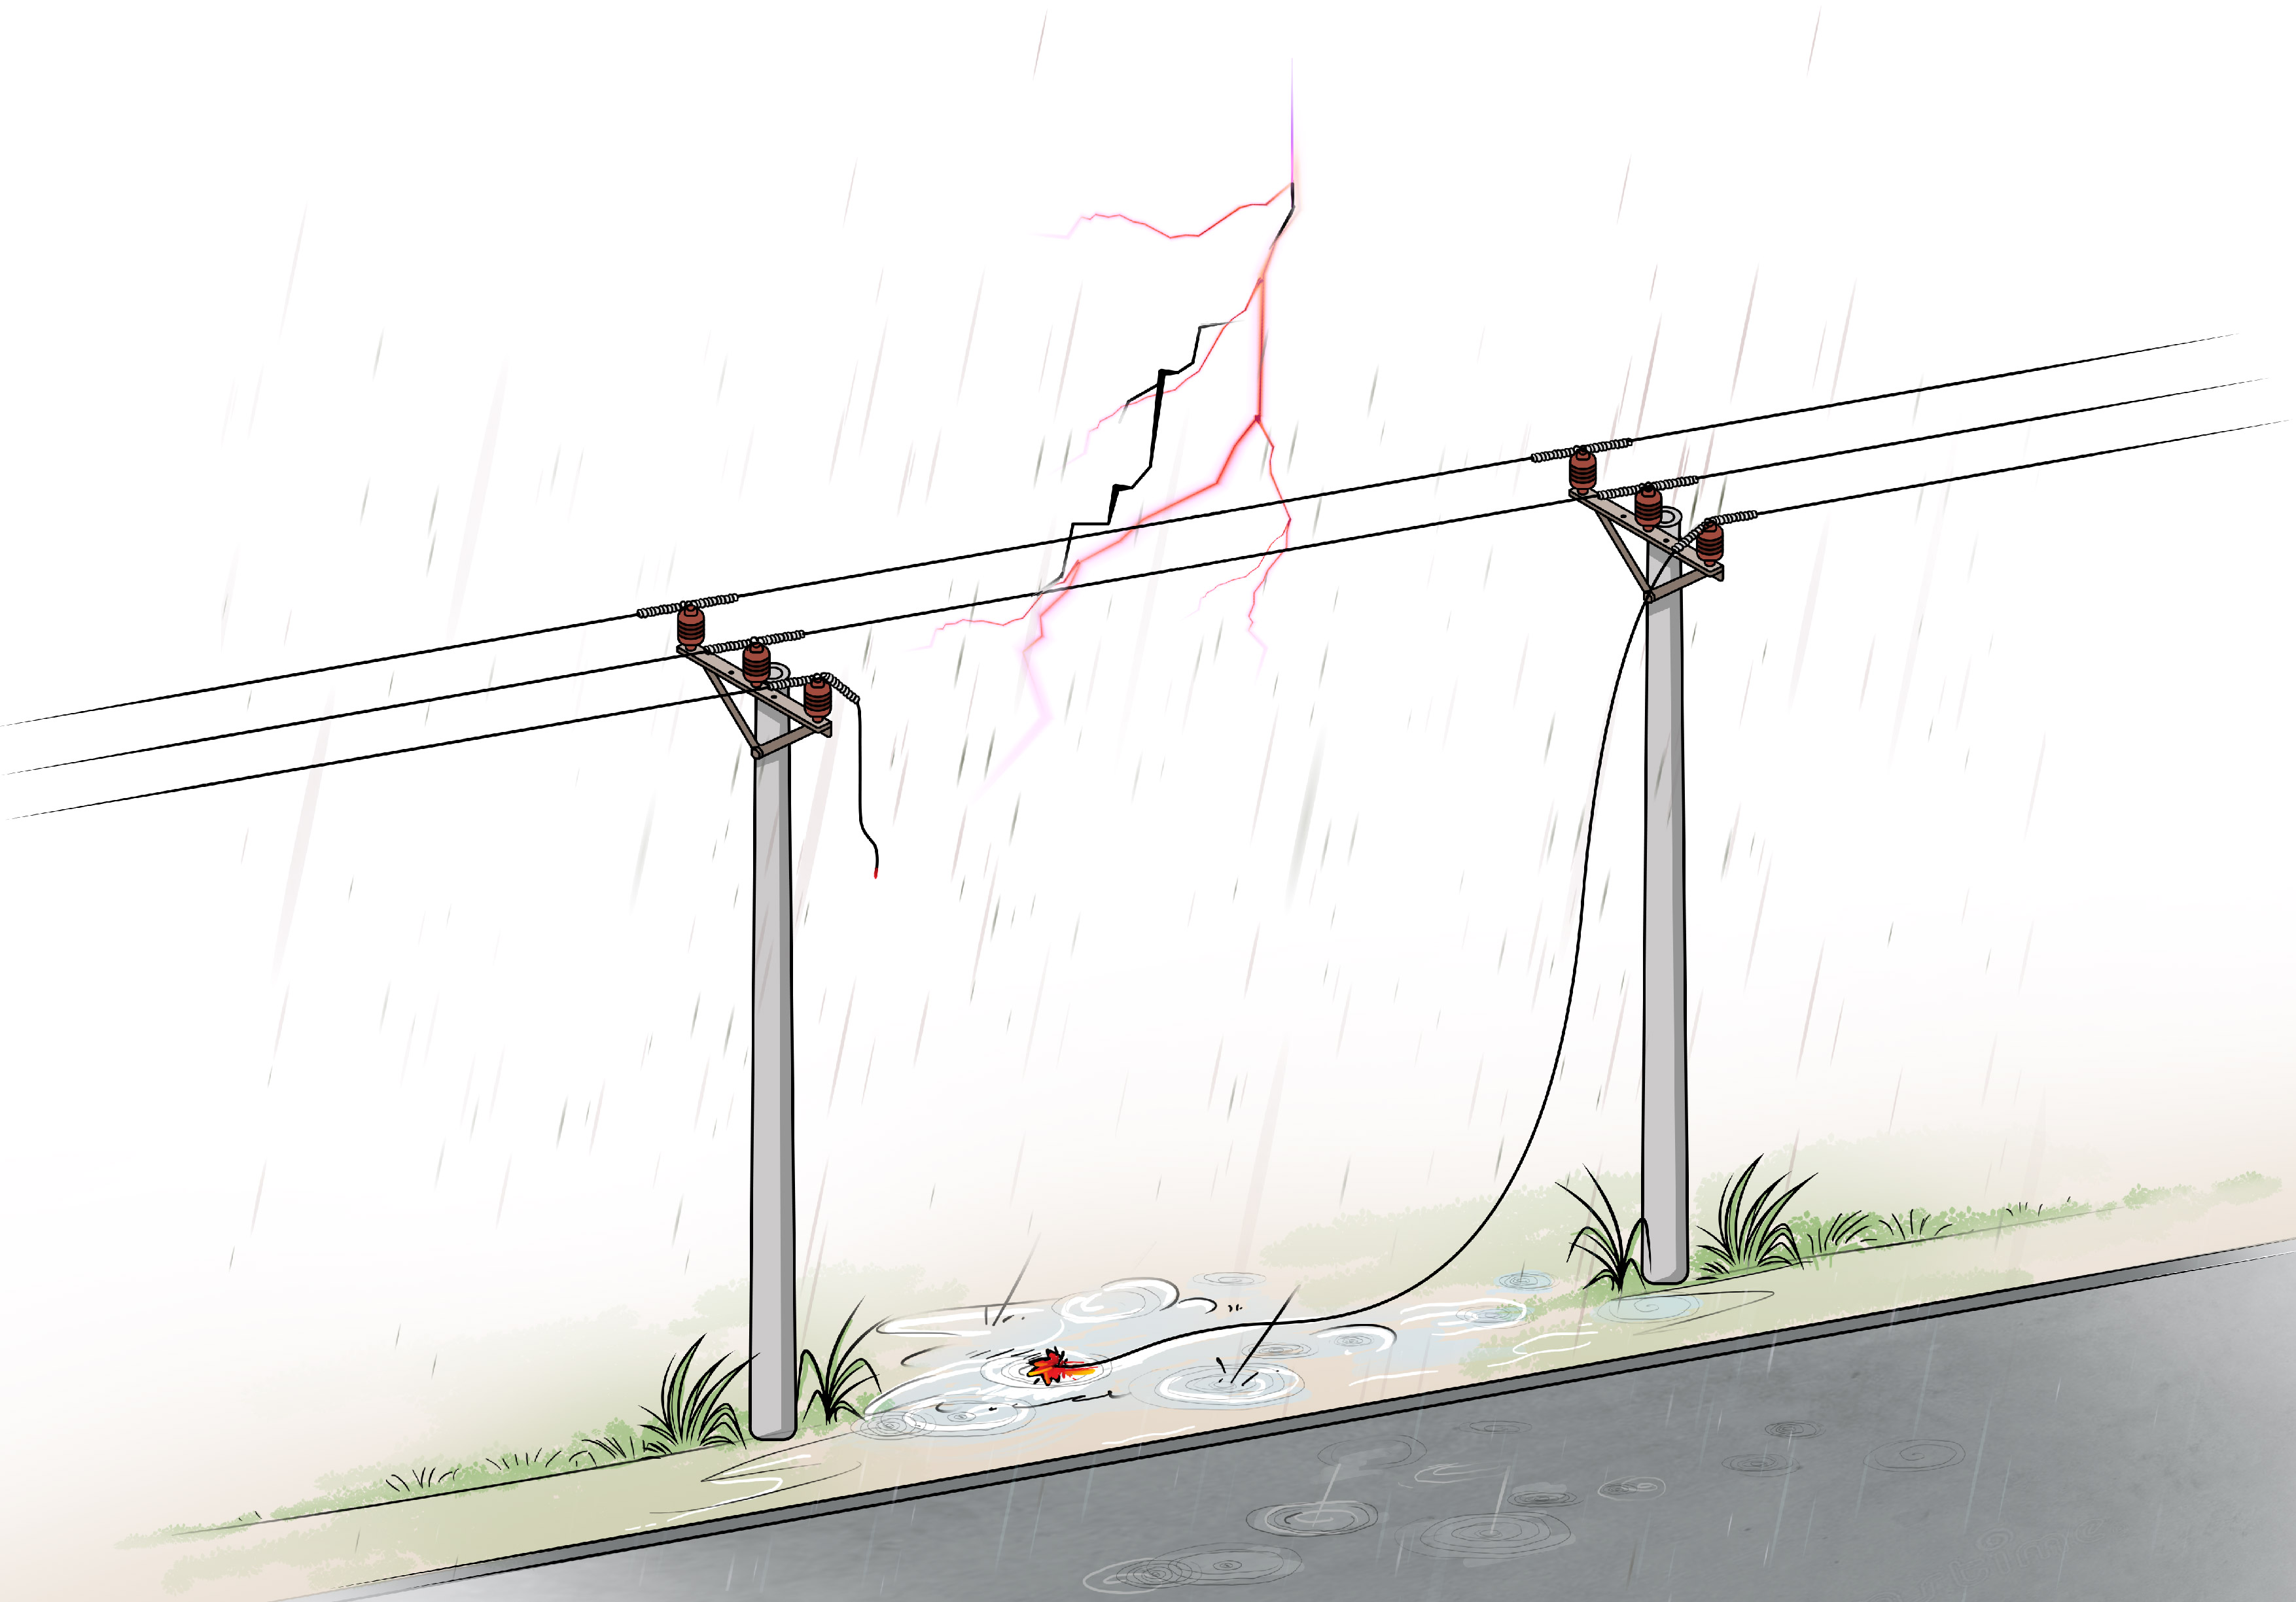
Lastly, if there are continuous faults, another reason could be due to severe weather conditions, caused especially by thunderstorms and lightning. This increases the likelihood of flash-over events which as mentioned are detrimental to human life and grid assets. Accurately pin-pointing such scenarios would also justify the need for additional investment in grid infrastructure or equipment to clear faults and reduce overvoltage events through simple solutions such as installing a SWER (Single-wire earth return) line or additional auto-reclosers.
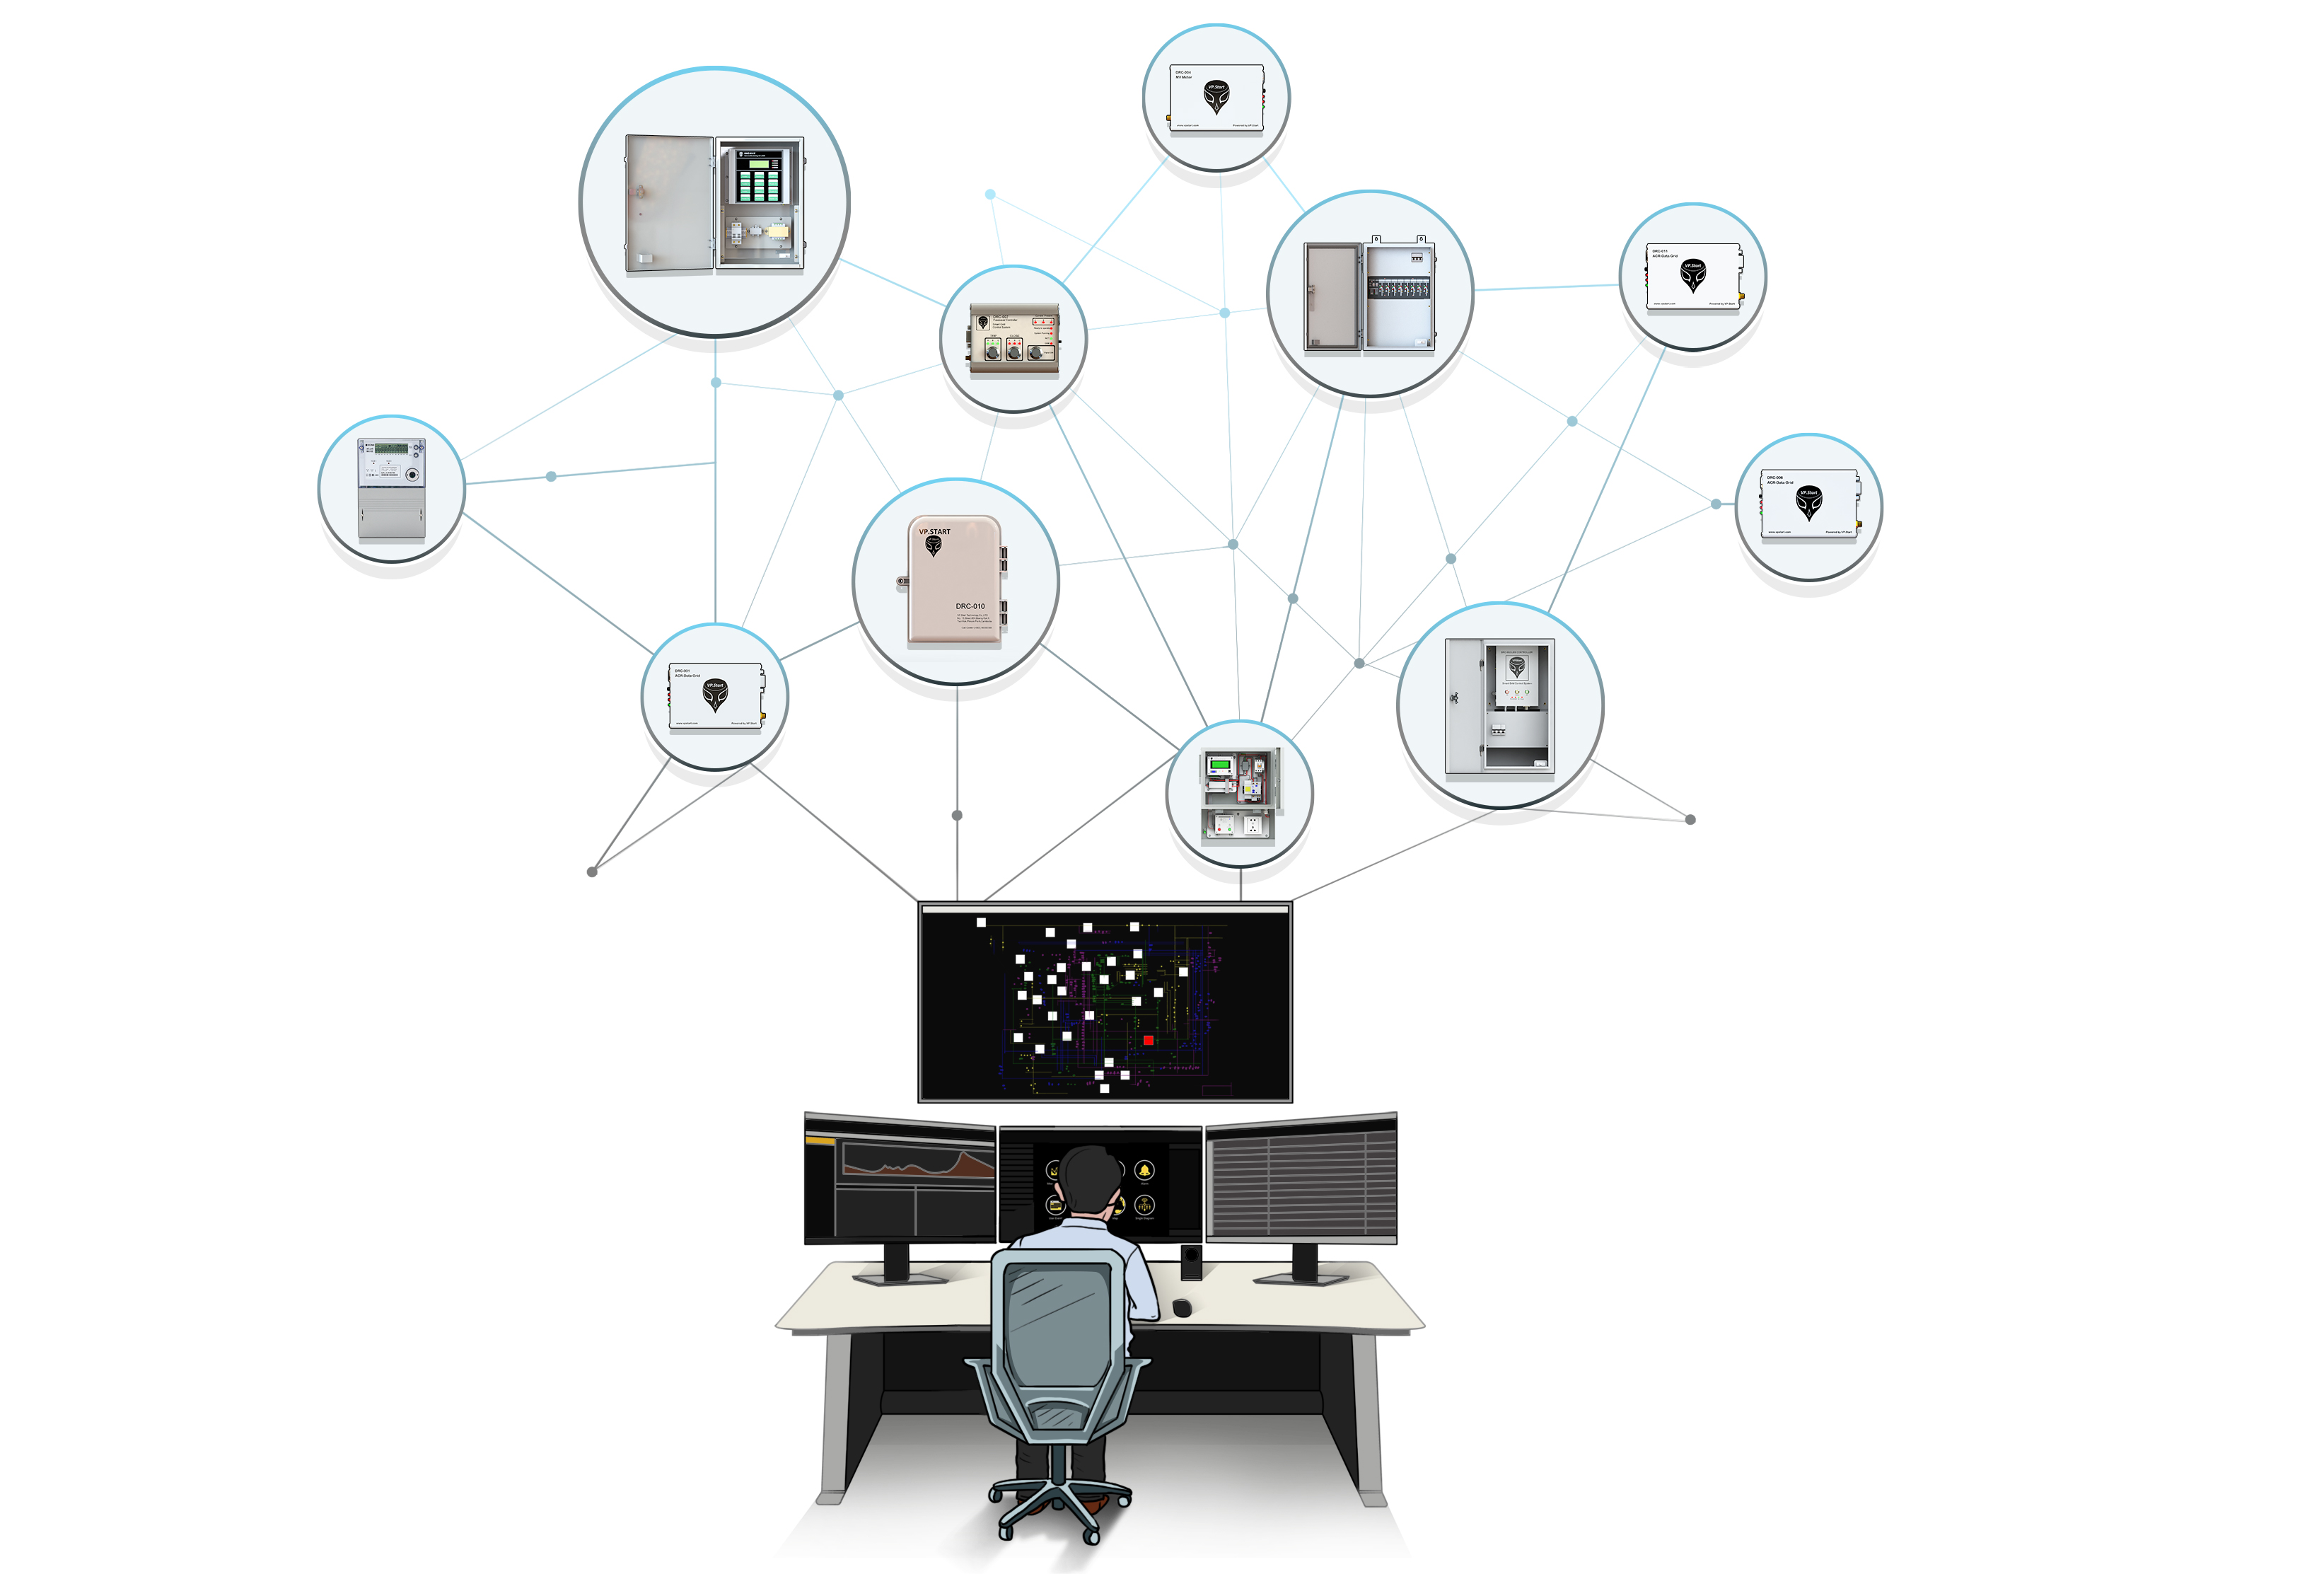
INVEST IN ADDITIONAL ELECTRICAL EQUIPMENT, REMOTE CONTROLS & SCADA OR ADMS SOLUTIONS.
The “electrical power grid” as we know it, is a marvel of human engineering with the first version of it having been launched over a hundred years ago on Pearl Street in New York City by Thomas Edison. A hundred or so years later, modern variations of it are aging and so have the many electrical grid assets and equipment which are being used to operate it across generation, transmission, and distribution grids. Throughout the world. In some cases, circuit breakers in the U.S. are averaging twenty to fifty years in their life cycle according to research but are still in operation. Technologically, these scenarios across the grid are common as multiple different types of legacy systems and equipment are still in operation. On the flip side - from the consumer perspective, unfortunately, the average consumer seldom thinks about the critical role all the components and functions the power systems within the grid play towards “keeping the lights on” or in other words, when we flick a switch.
Energy is vital to run cities and helping us all maintain our standards of living and businesses. Today, the positive is that geopolitics and the consequences of climate change have pushed increased awareness about our relationship with energy. This has shed light on the many systems and assets that are relatively “dumb” and lack many of the modern functionalities such as automation, asset tracking, interoperability and easy integration, etc, that we are becoming increasingly accustomed to today throughout every industry or sector, not just the power-grid which is traditionally run by the government, heavily regulated and as a consequence shielded away from much-needed innovation. SCADA (Supervisory control and data acquisition) systems and technology for the energy industry itself have existed since the 1960s! Hence, the grid in some parts of the world is suffering from “dumb technologies”.
The grid of today and of the future certainly requires additional investment and innovative solutions to further stabilize and modernize it. Therefore, a “Smart-Grid” that is resilient, reliable, and sustainable is ever so needed to meet the complex demands and challenges of not just today’s needs but also of the future.
By now, after reading through this overview of what it takes to manage the basics of distribution grids, one can undeniably conclude that data is at the center of it all. Whether you are combining the old with the new, which is being done effectively through IoT technologies by our team of talented engineers or completely rehauling and out-fitting distribution grids with the latest hardware and software (Which can be very expensive and time-consuming). The fact remains that at the center of it all - Data monitoring, collection, analysis, forecasting, and in some cases AI (Artificial-Intelligence) assisted predictions eventually aid the operator’s decision making. These functions are all based on data that is collected, processed, and visualized through software platforms like SCADA (Supervisory Control And Data Acquisition) Systems, EMS (Energy Management System) or ADMS (Advanced Distribution Management System) that allow for remote-control operation and automation for the power-grid, moreover a “Smart-Grid” - Ensuring higher reliability standards, reduction of operational and capital costs, saving humans lives and keeping the environment cleaner.